Case Study LibraryPortfolio Reporting
Portfolio
Reporting
lead product designer
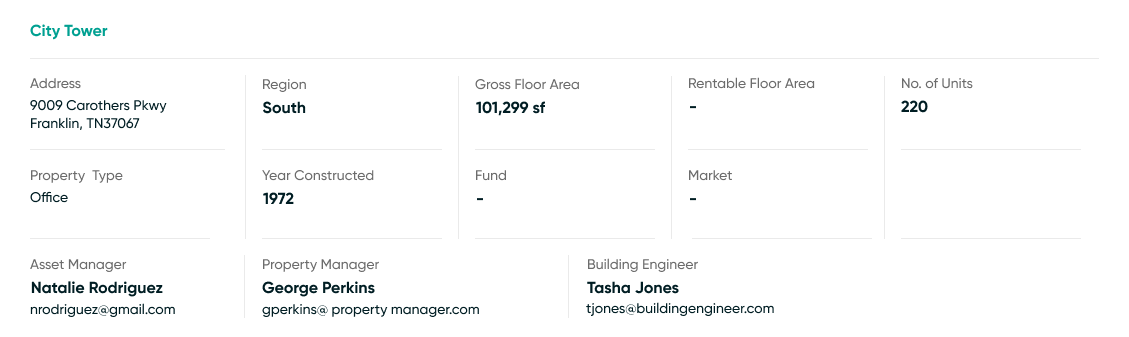
data platform linking the built world to the connected world
Problem
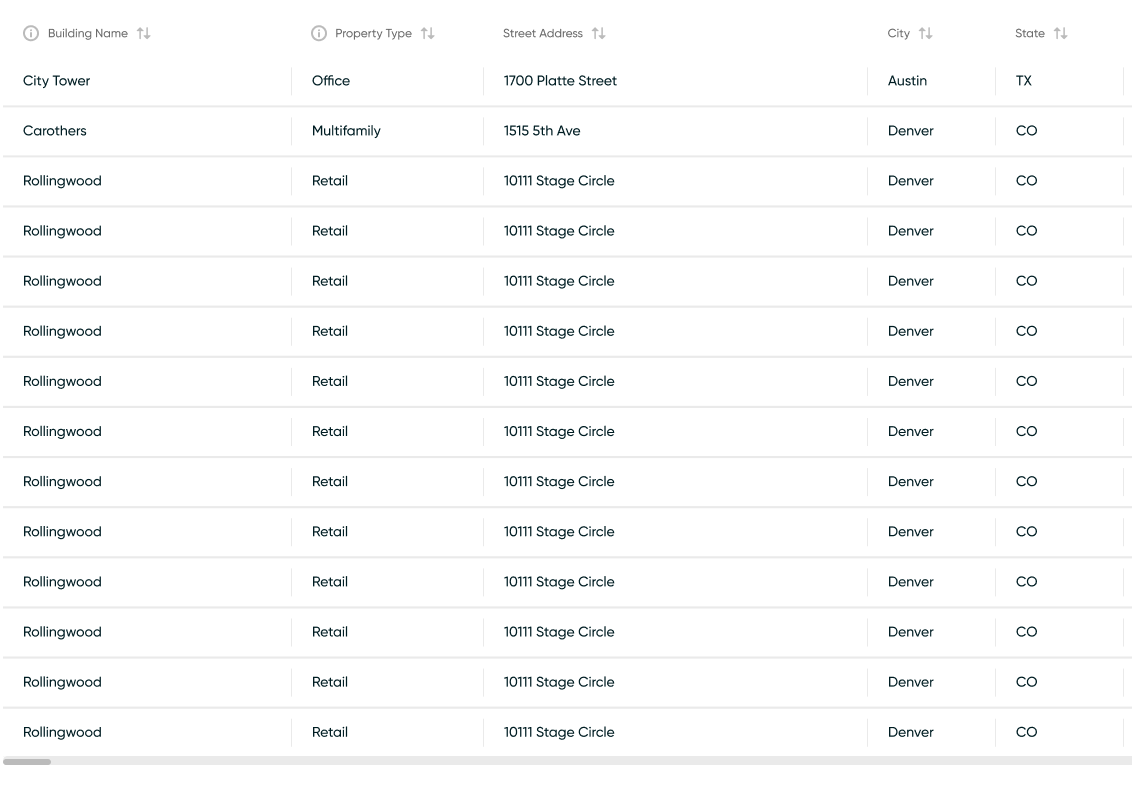
Our current report deliverable is below industry standard, which has turned interested prospects into unresponsive ghosts and creates burdensome internal business processes for our Customer Success team.
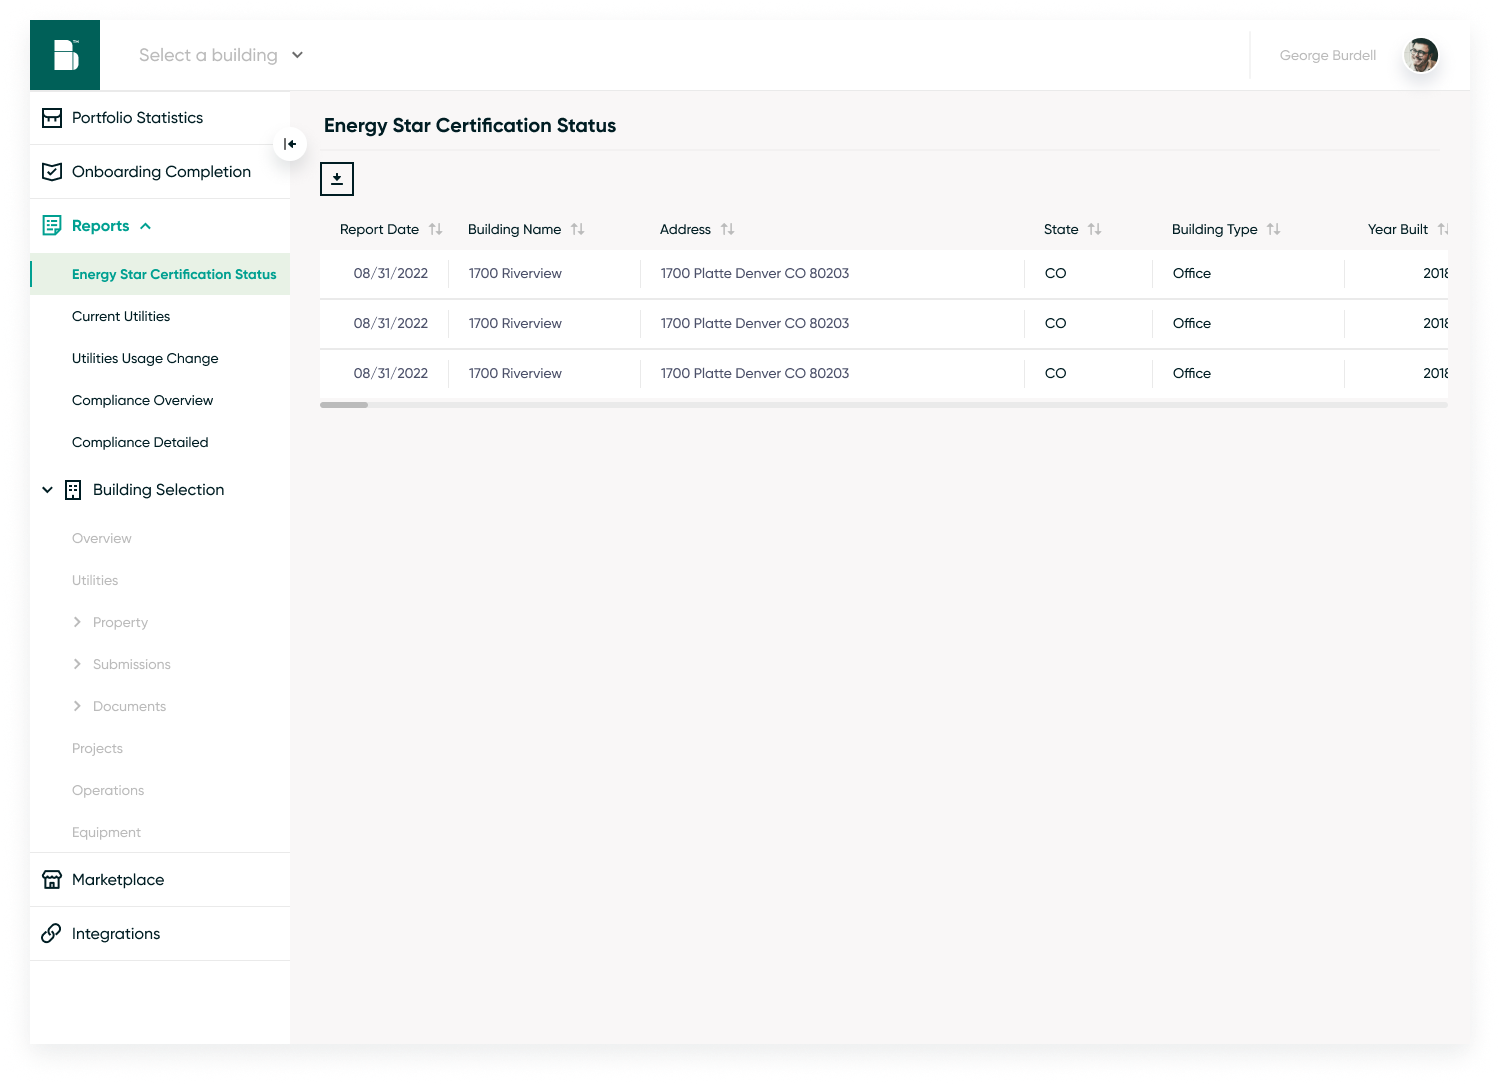
We want to create efficiencies for internal users who use the Reports feature to build and maintain customer relationships. Customers view downloadable reports as deliverables of software. Currently, our Customer Success team spends 2.5 - 7.5 hours a month reformatting our downloadable .csv, trying to reduce the risk of competitive disadvantage.
Existing State
Business Objectives
understanding
At this stage, we conducted a competitor analysis in order to understand the gaps in our reporting feature capabilities. We found other companies utilized single page reporting at the building level. In addition, we conducted several stakeholder interviews along the process with Customer Success eliminating time spent making changes to designs in a final state.
User Personas
- Oversees portfolio(s) of buildings (100+ buildings)
- Reports to Ownership about portfolio performance and needs
- Approves budgeting requirements
- Manages 1-3 buildings
- Oversees day to day operations of the building
- Reports to Asset Manager about building performance and needs
- Property Manager's point of contact when onboarding with Backpack
- Communicates through email and phone calls
- Point of contact for 100-120 Backpacks at various stages of onboarding

user outcomes
ideation
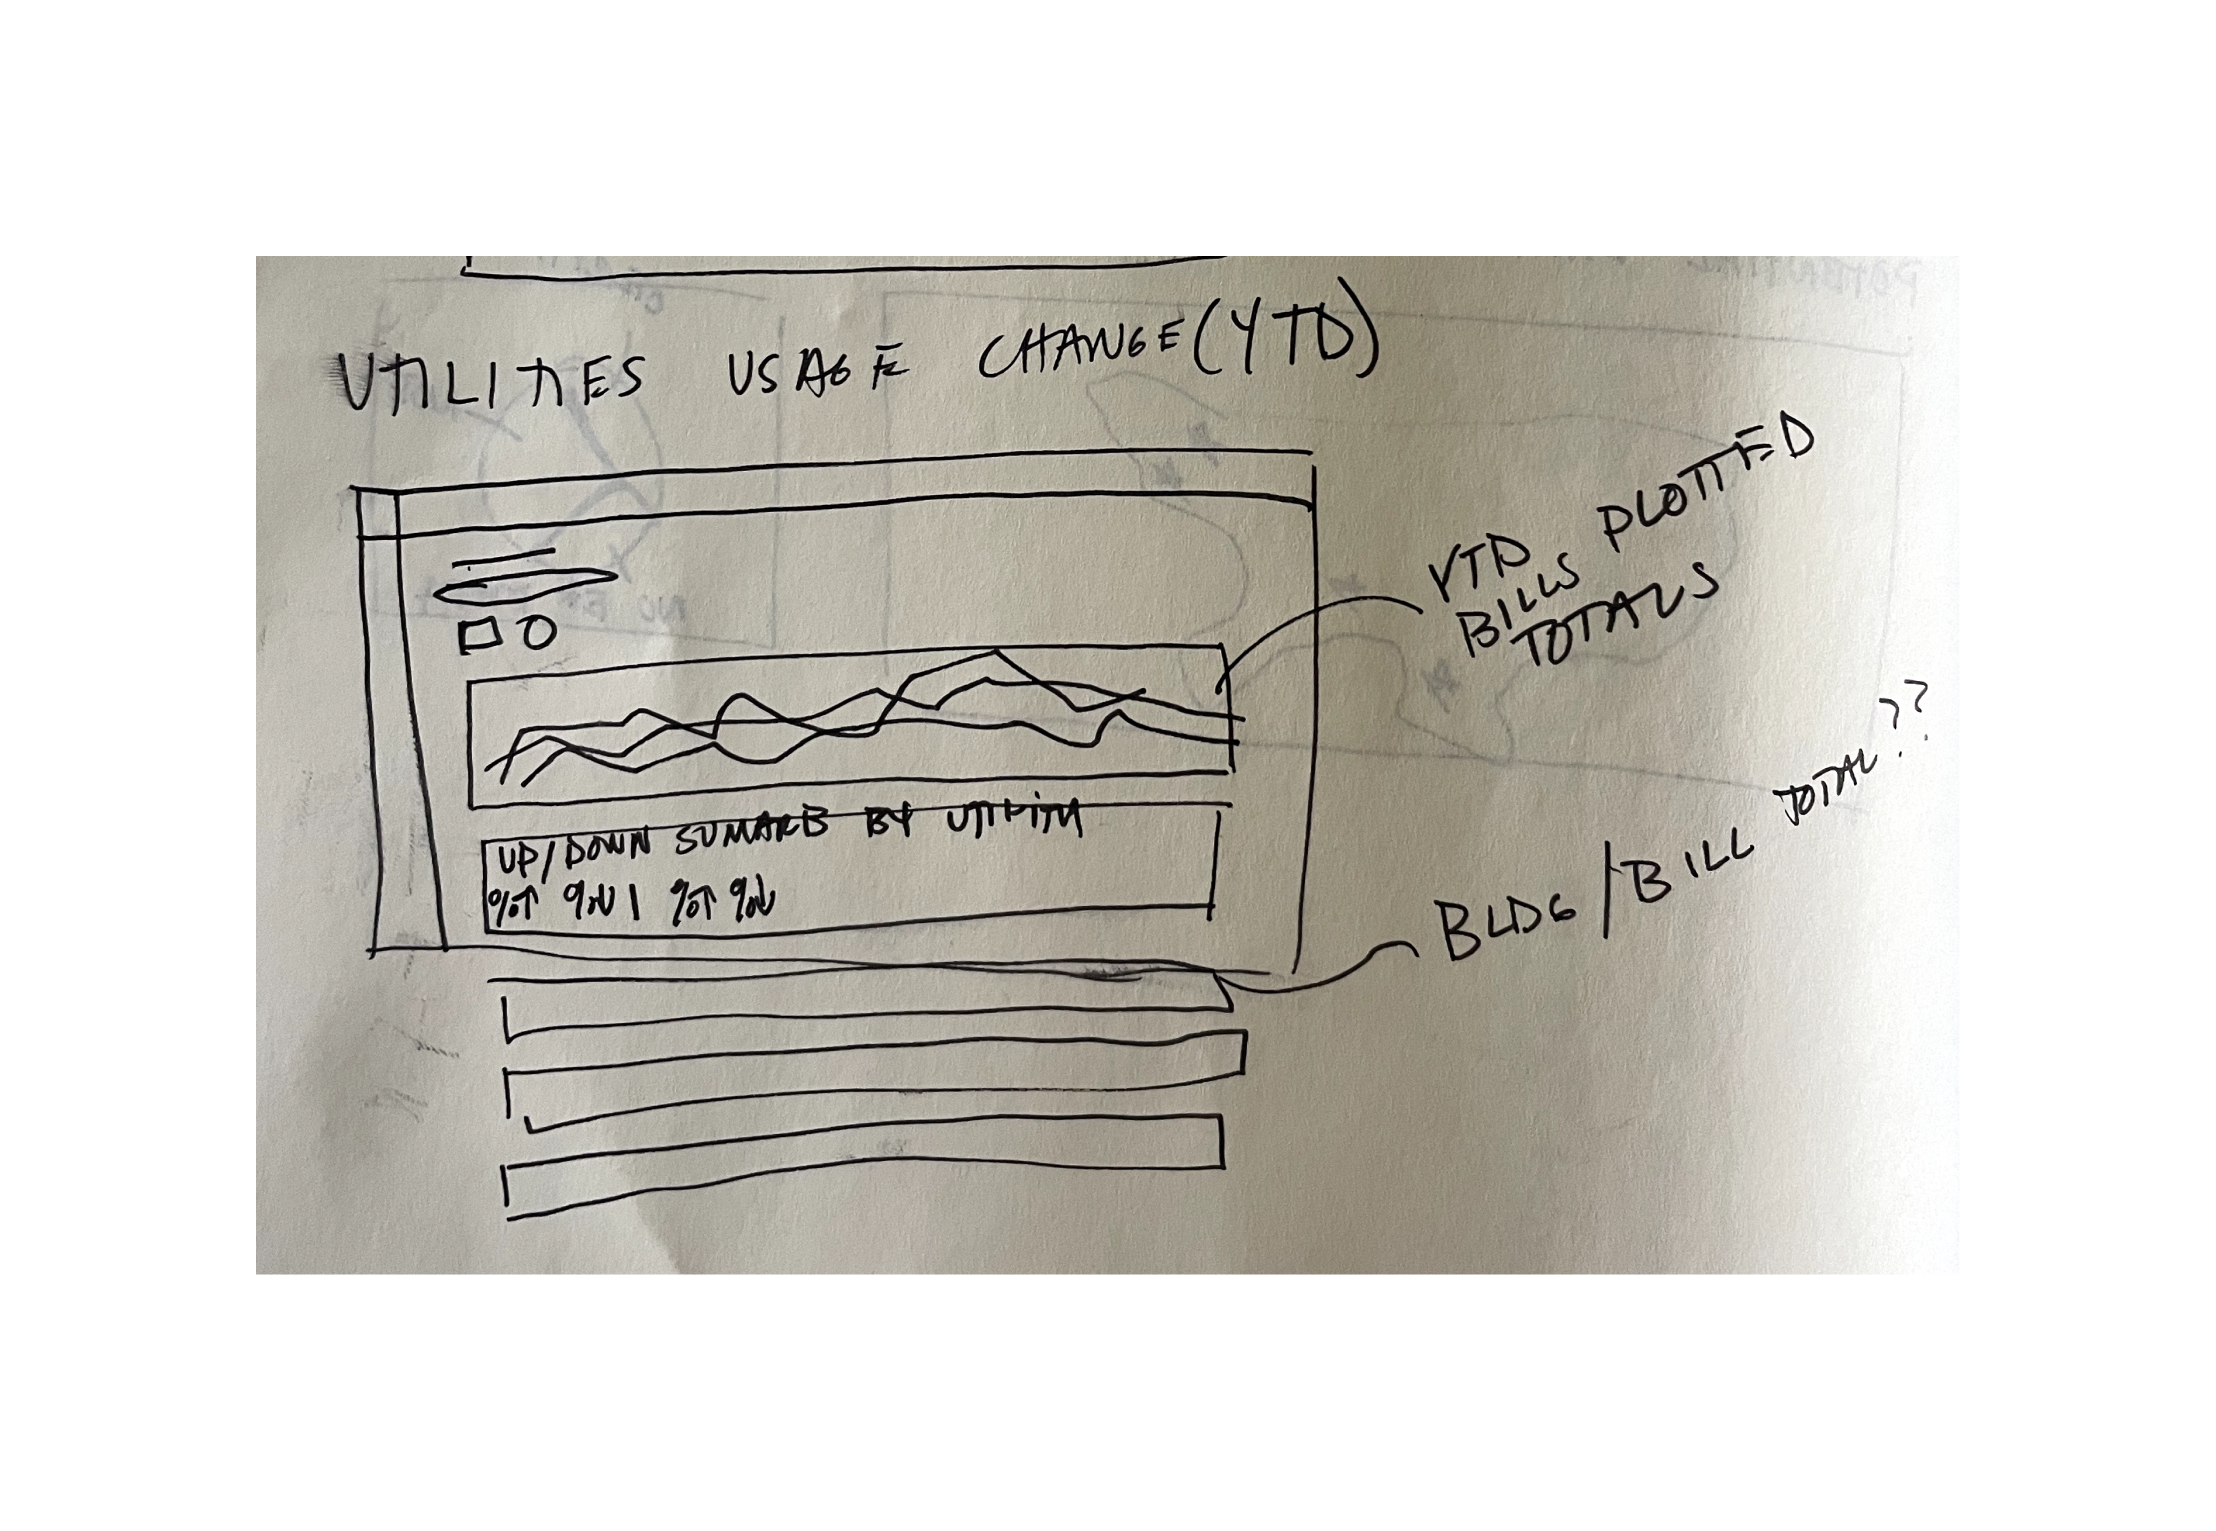
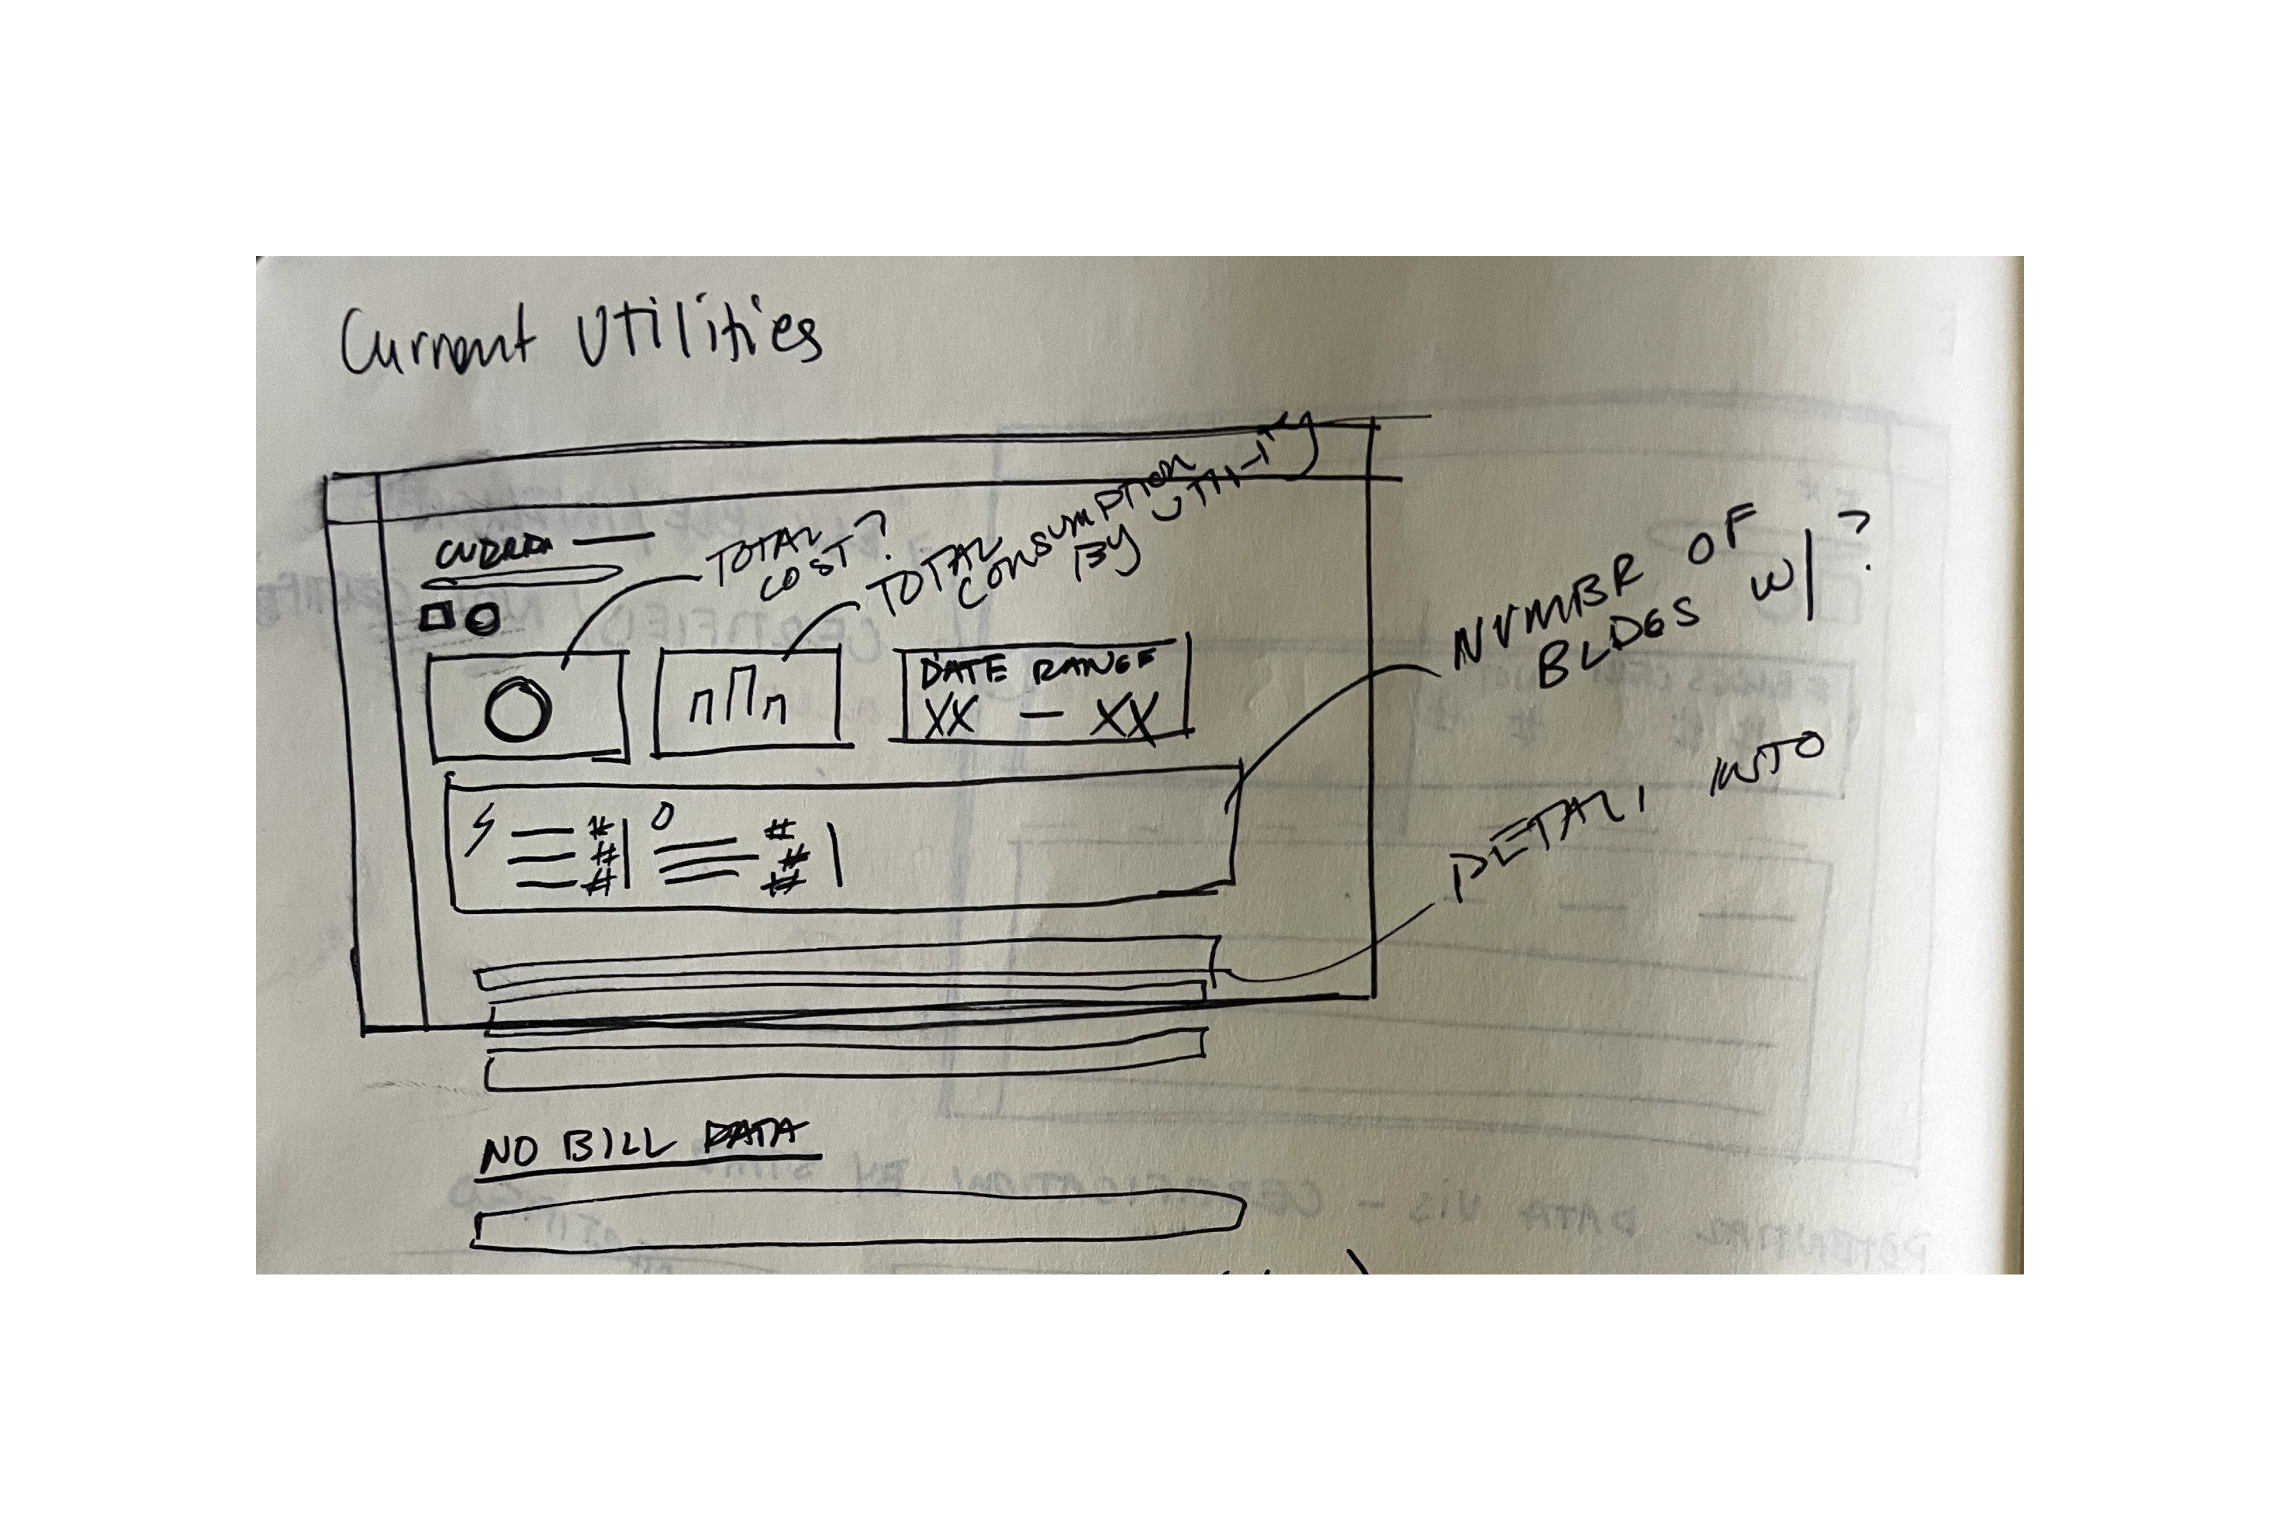
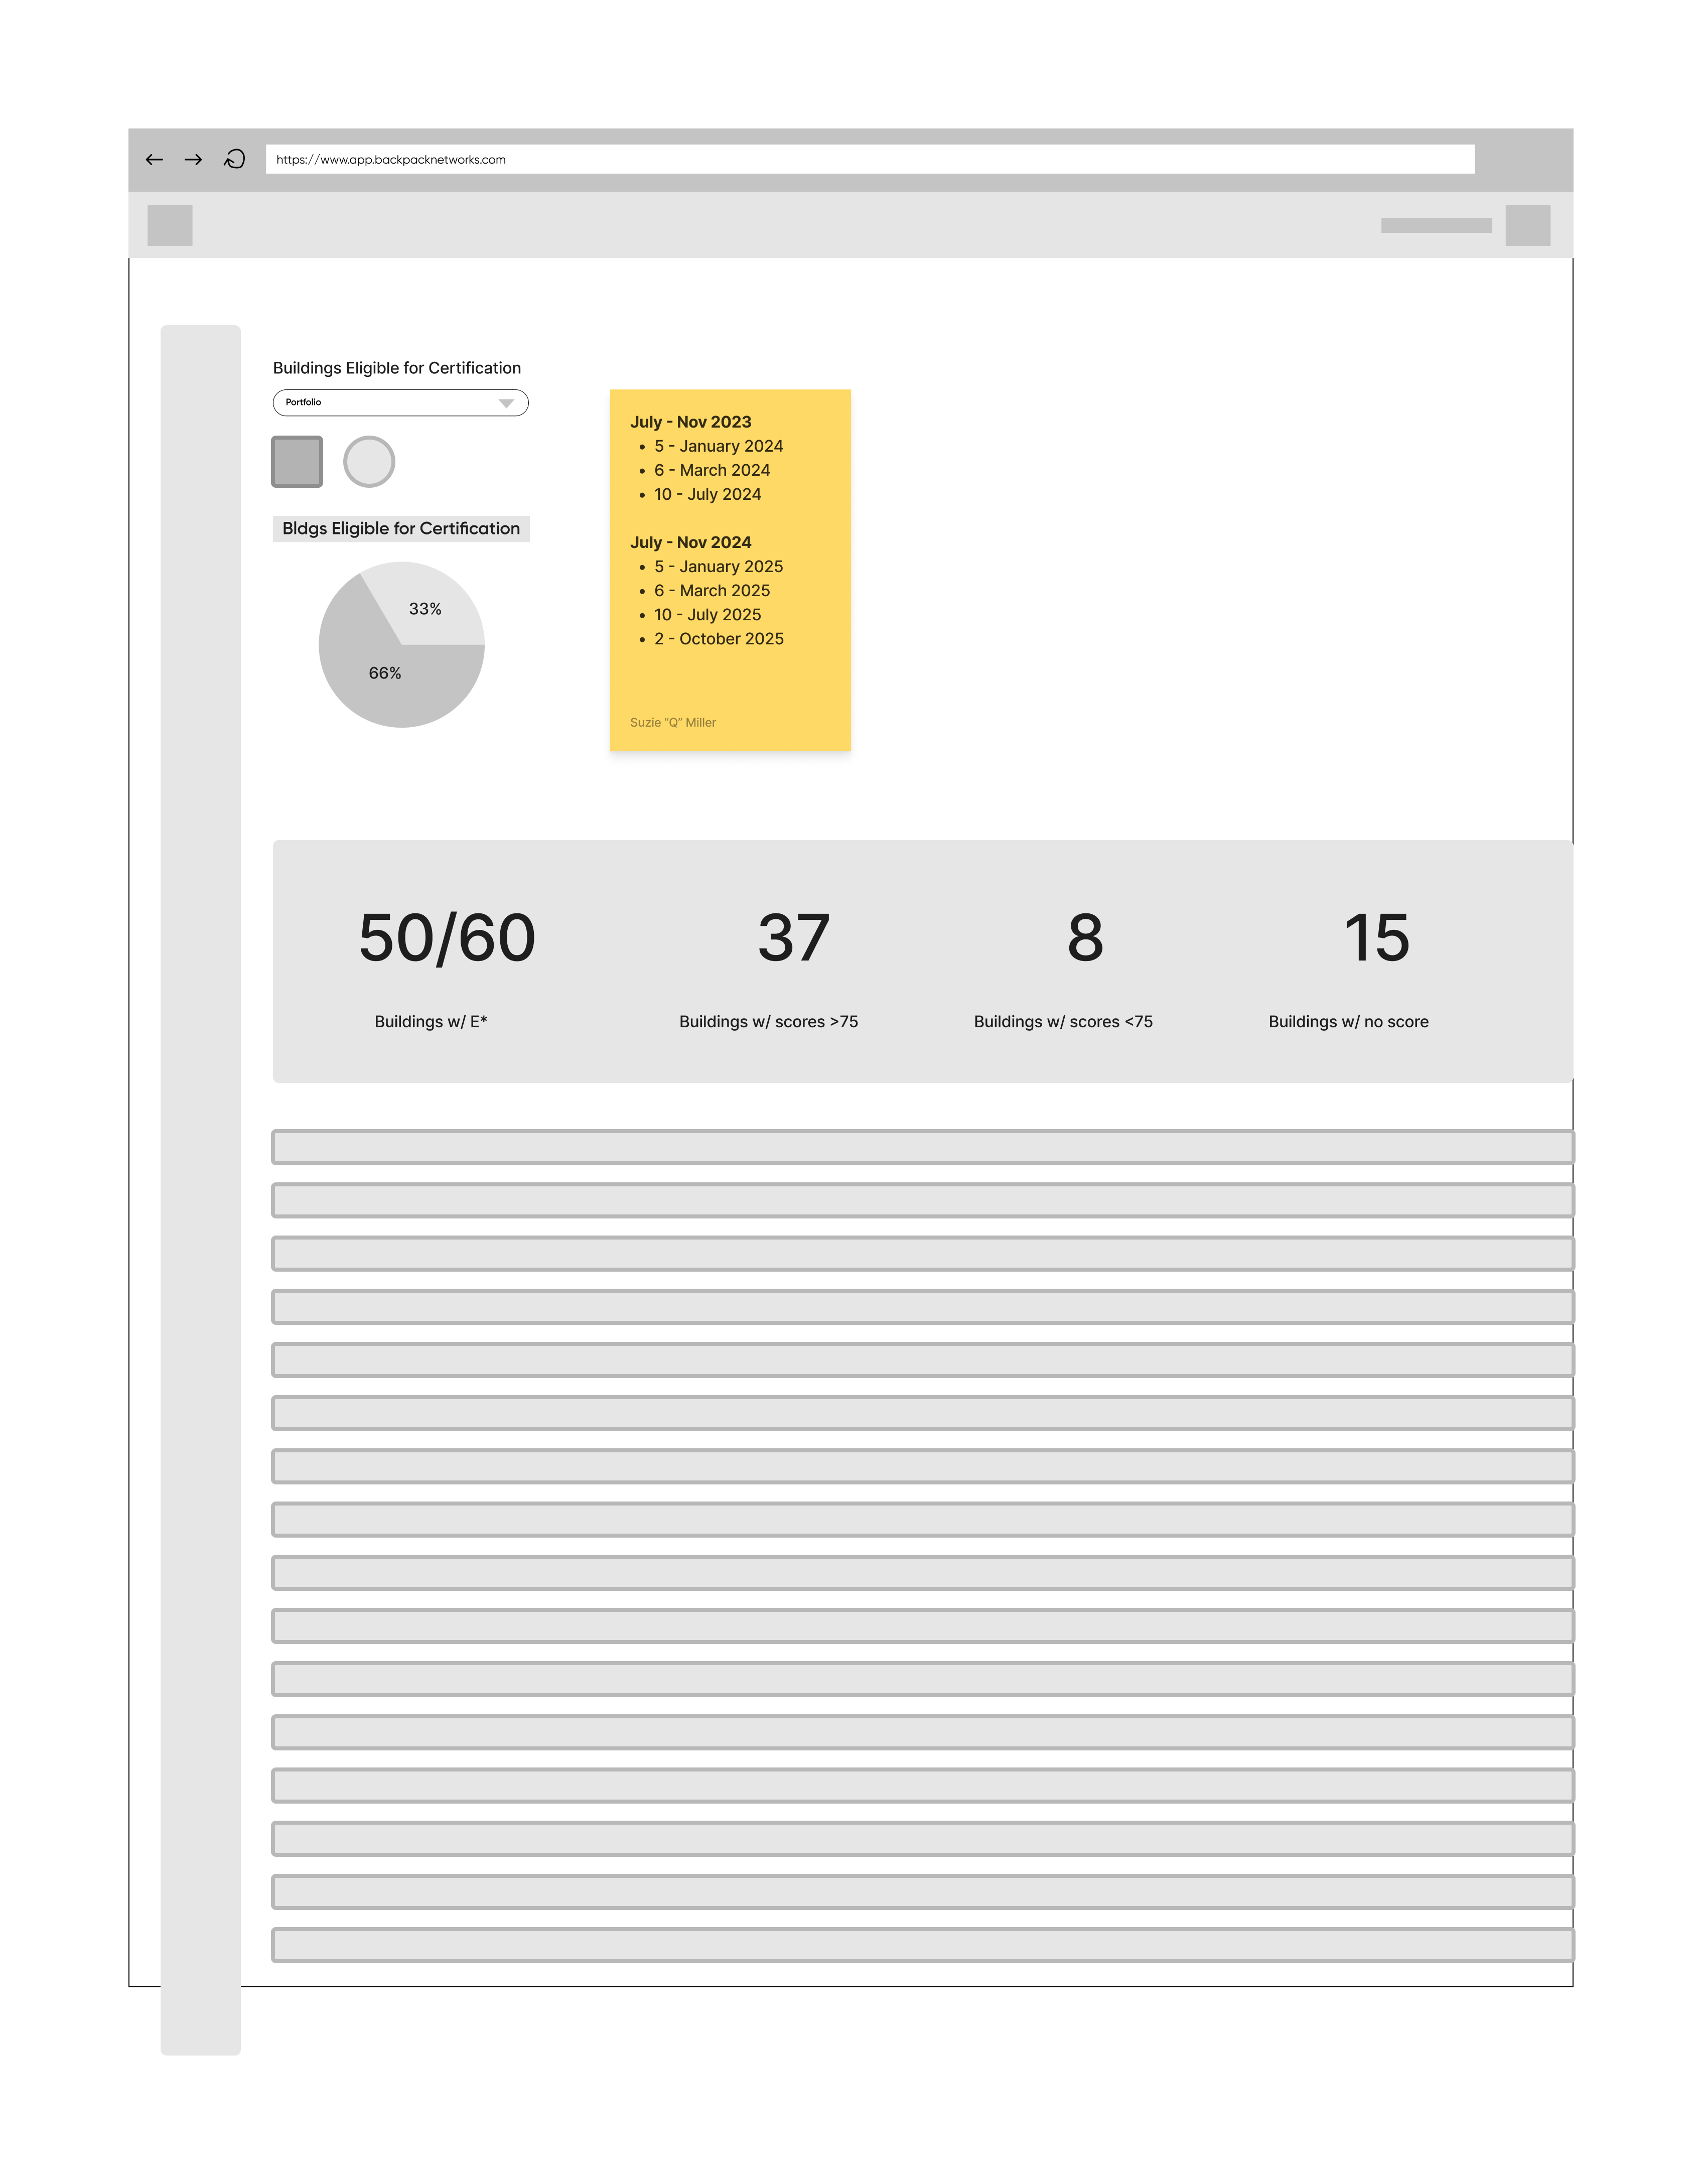
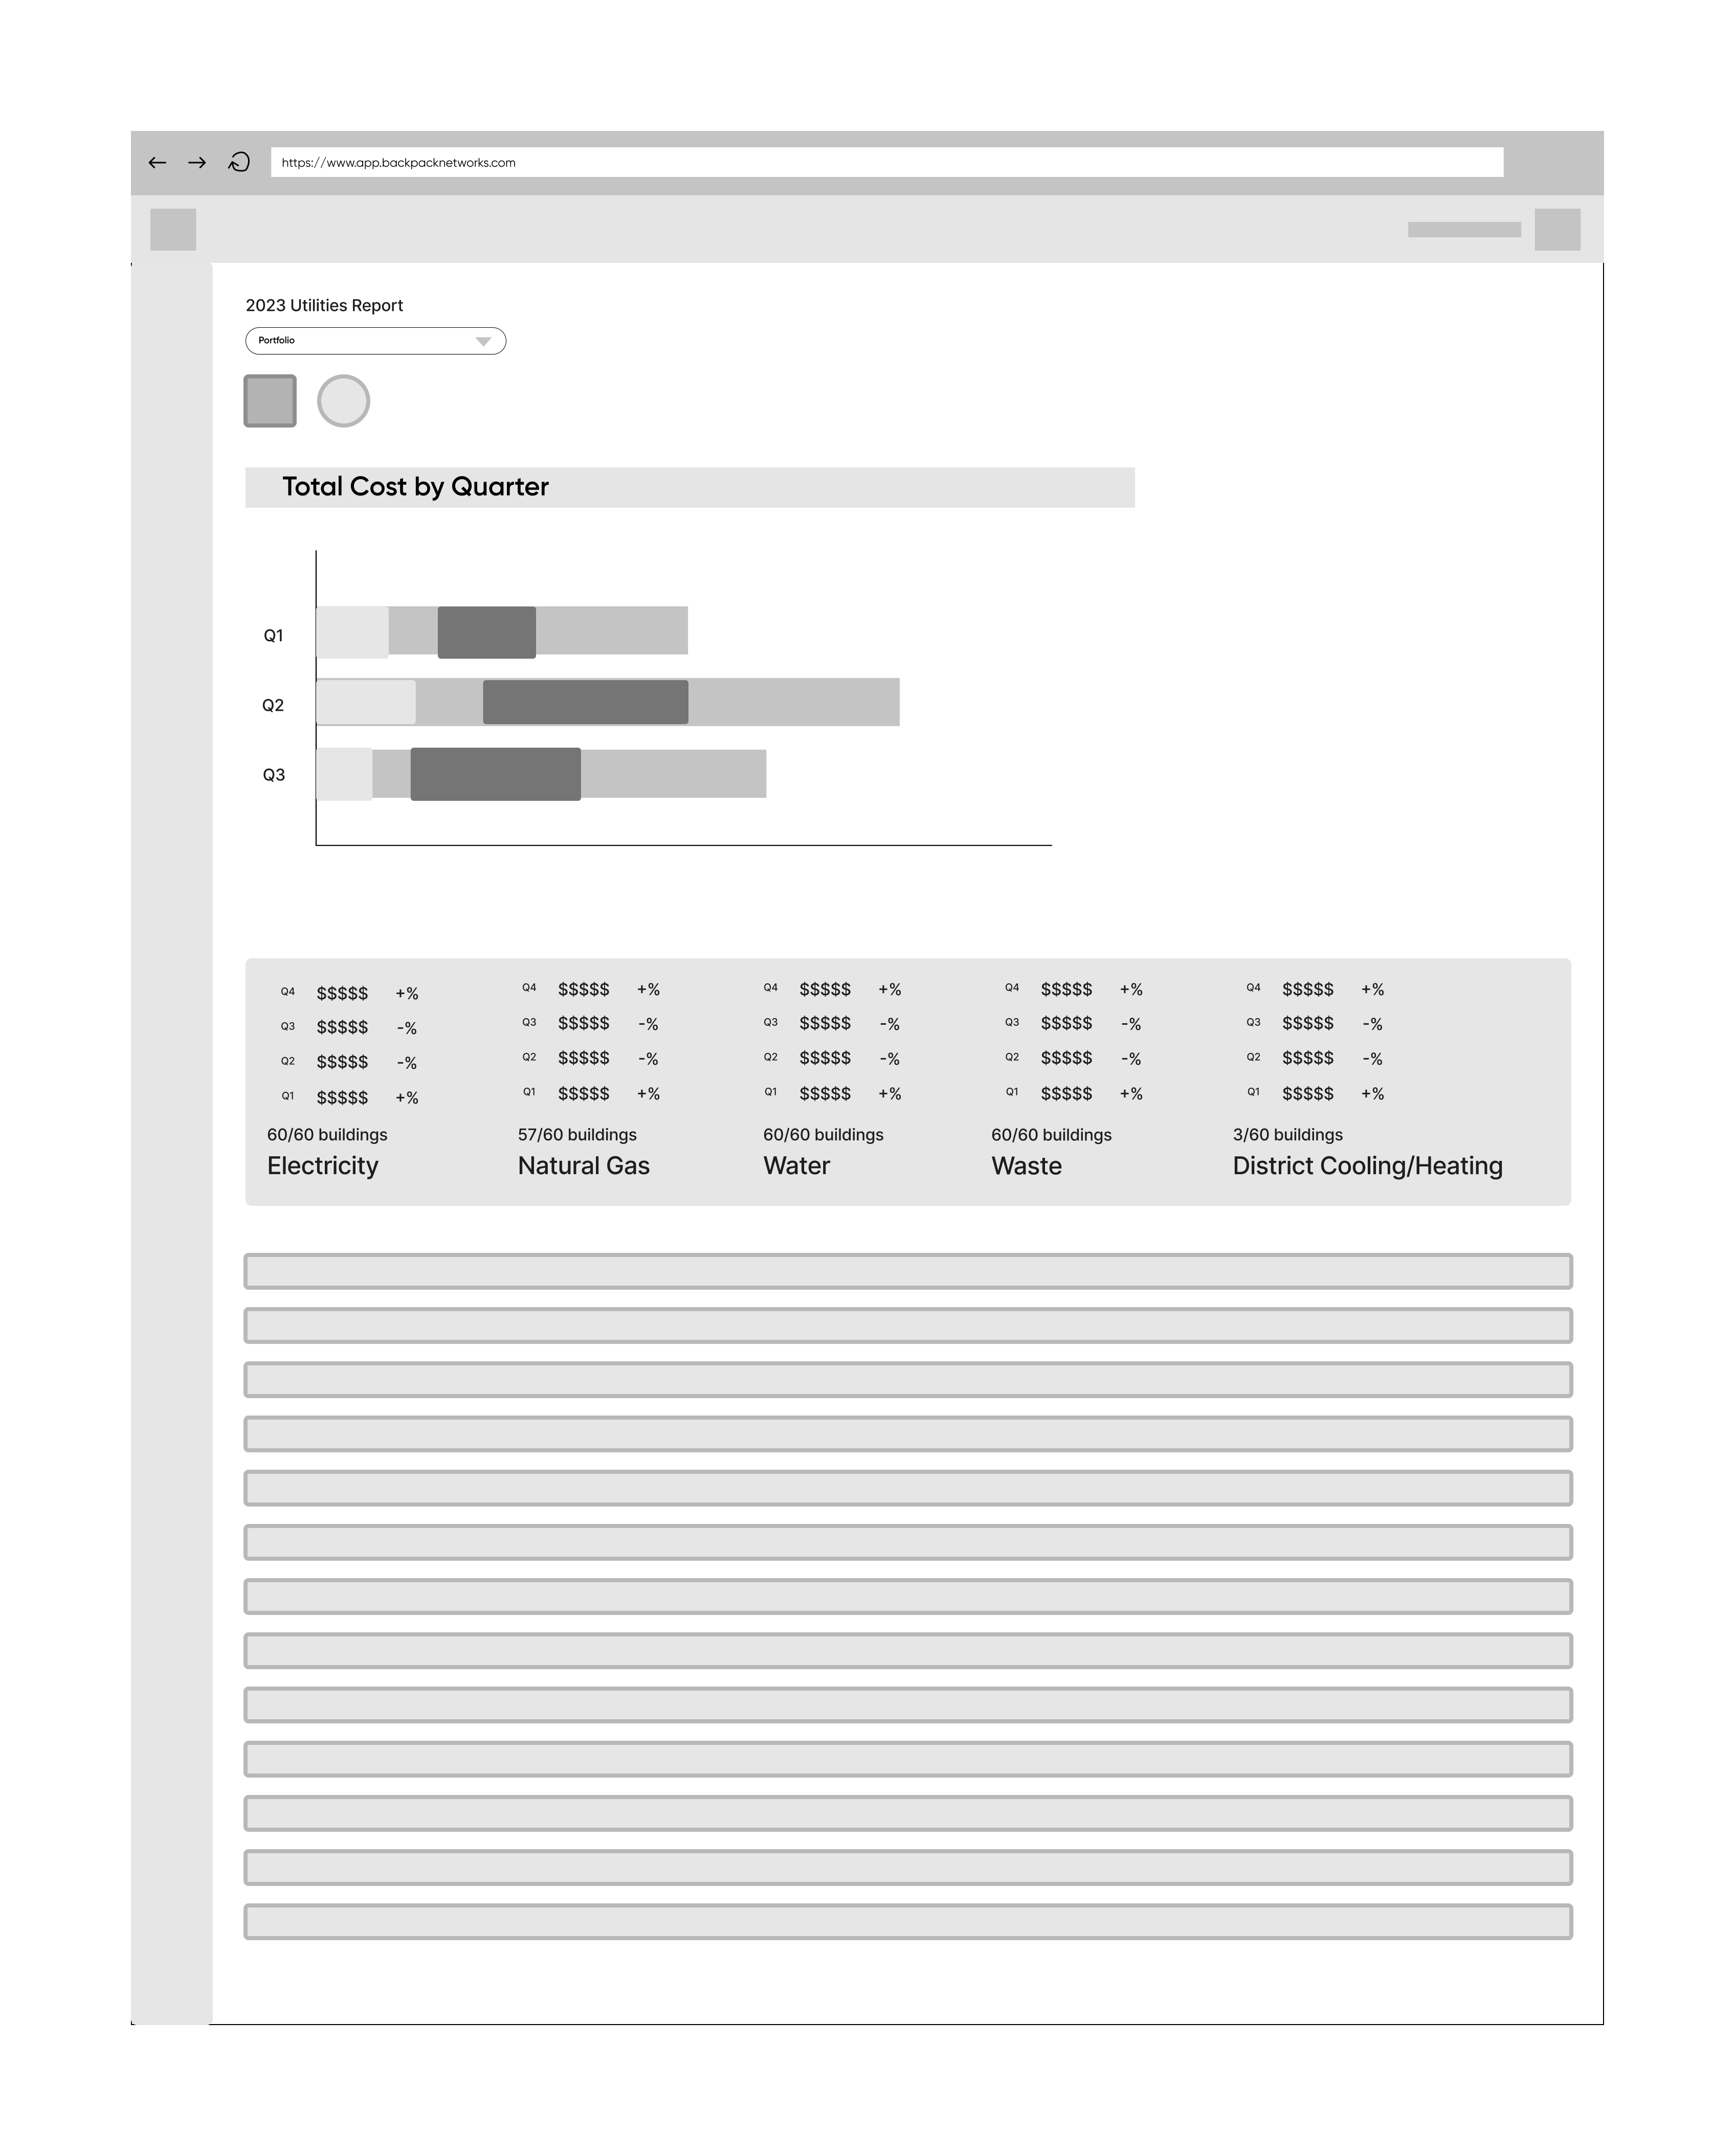
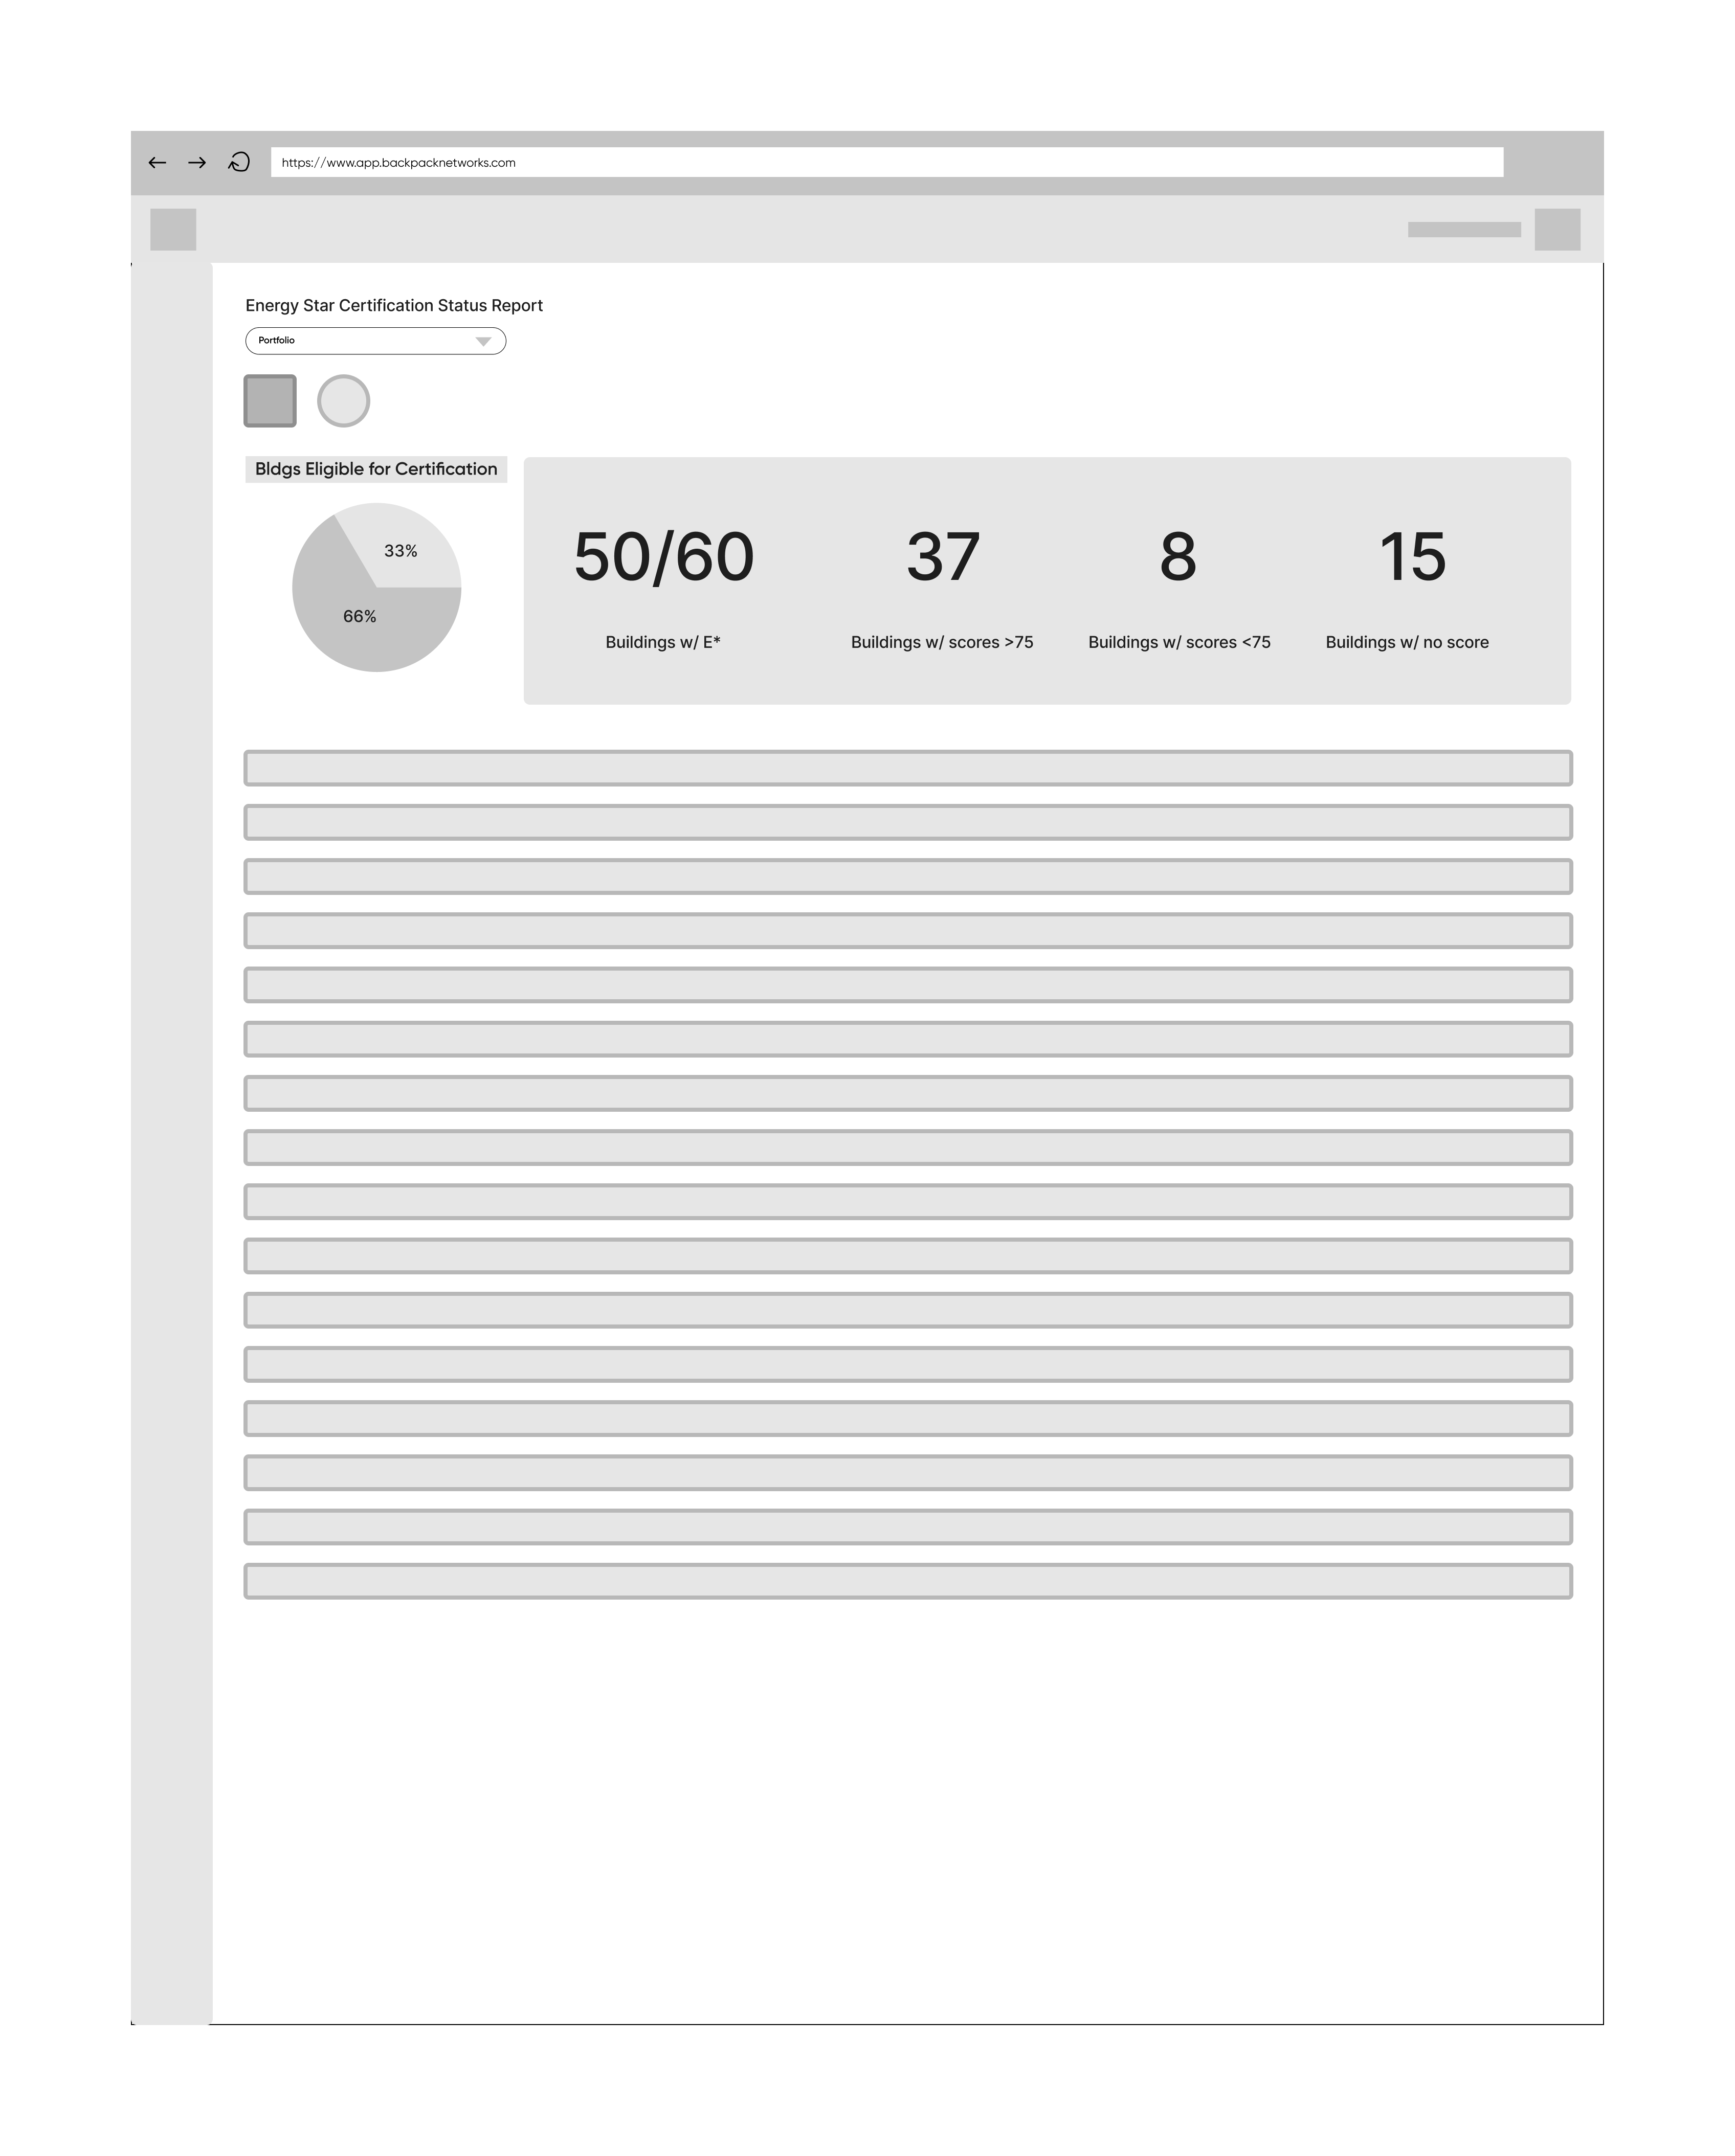
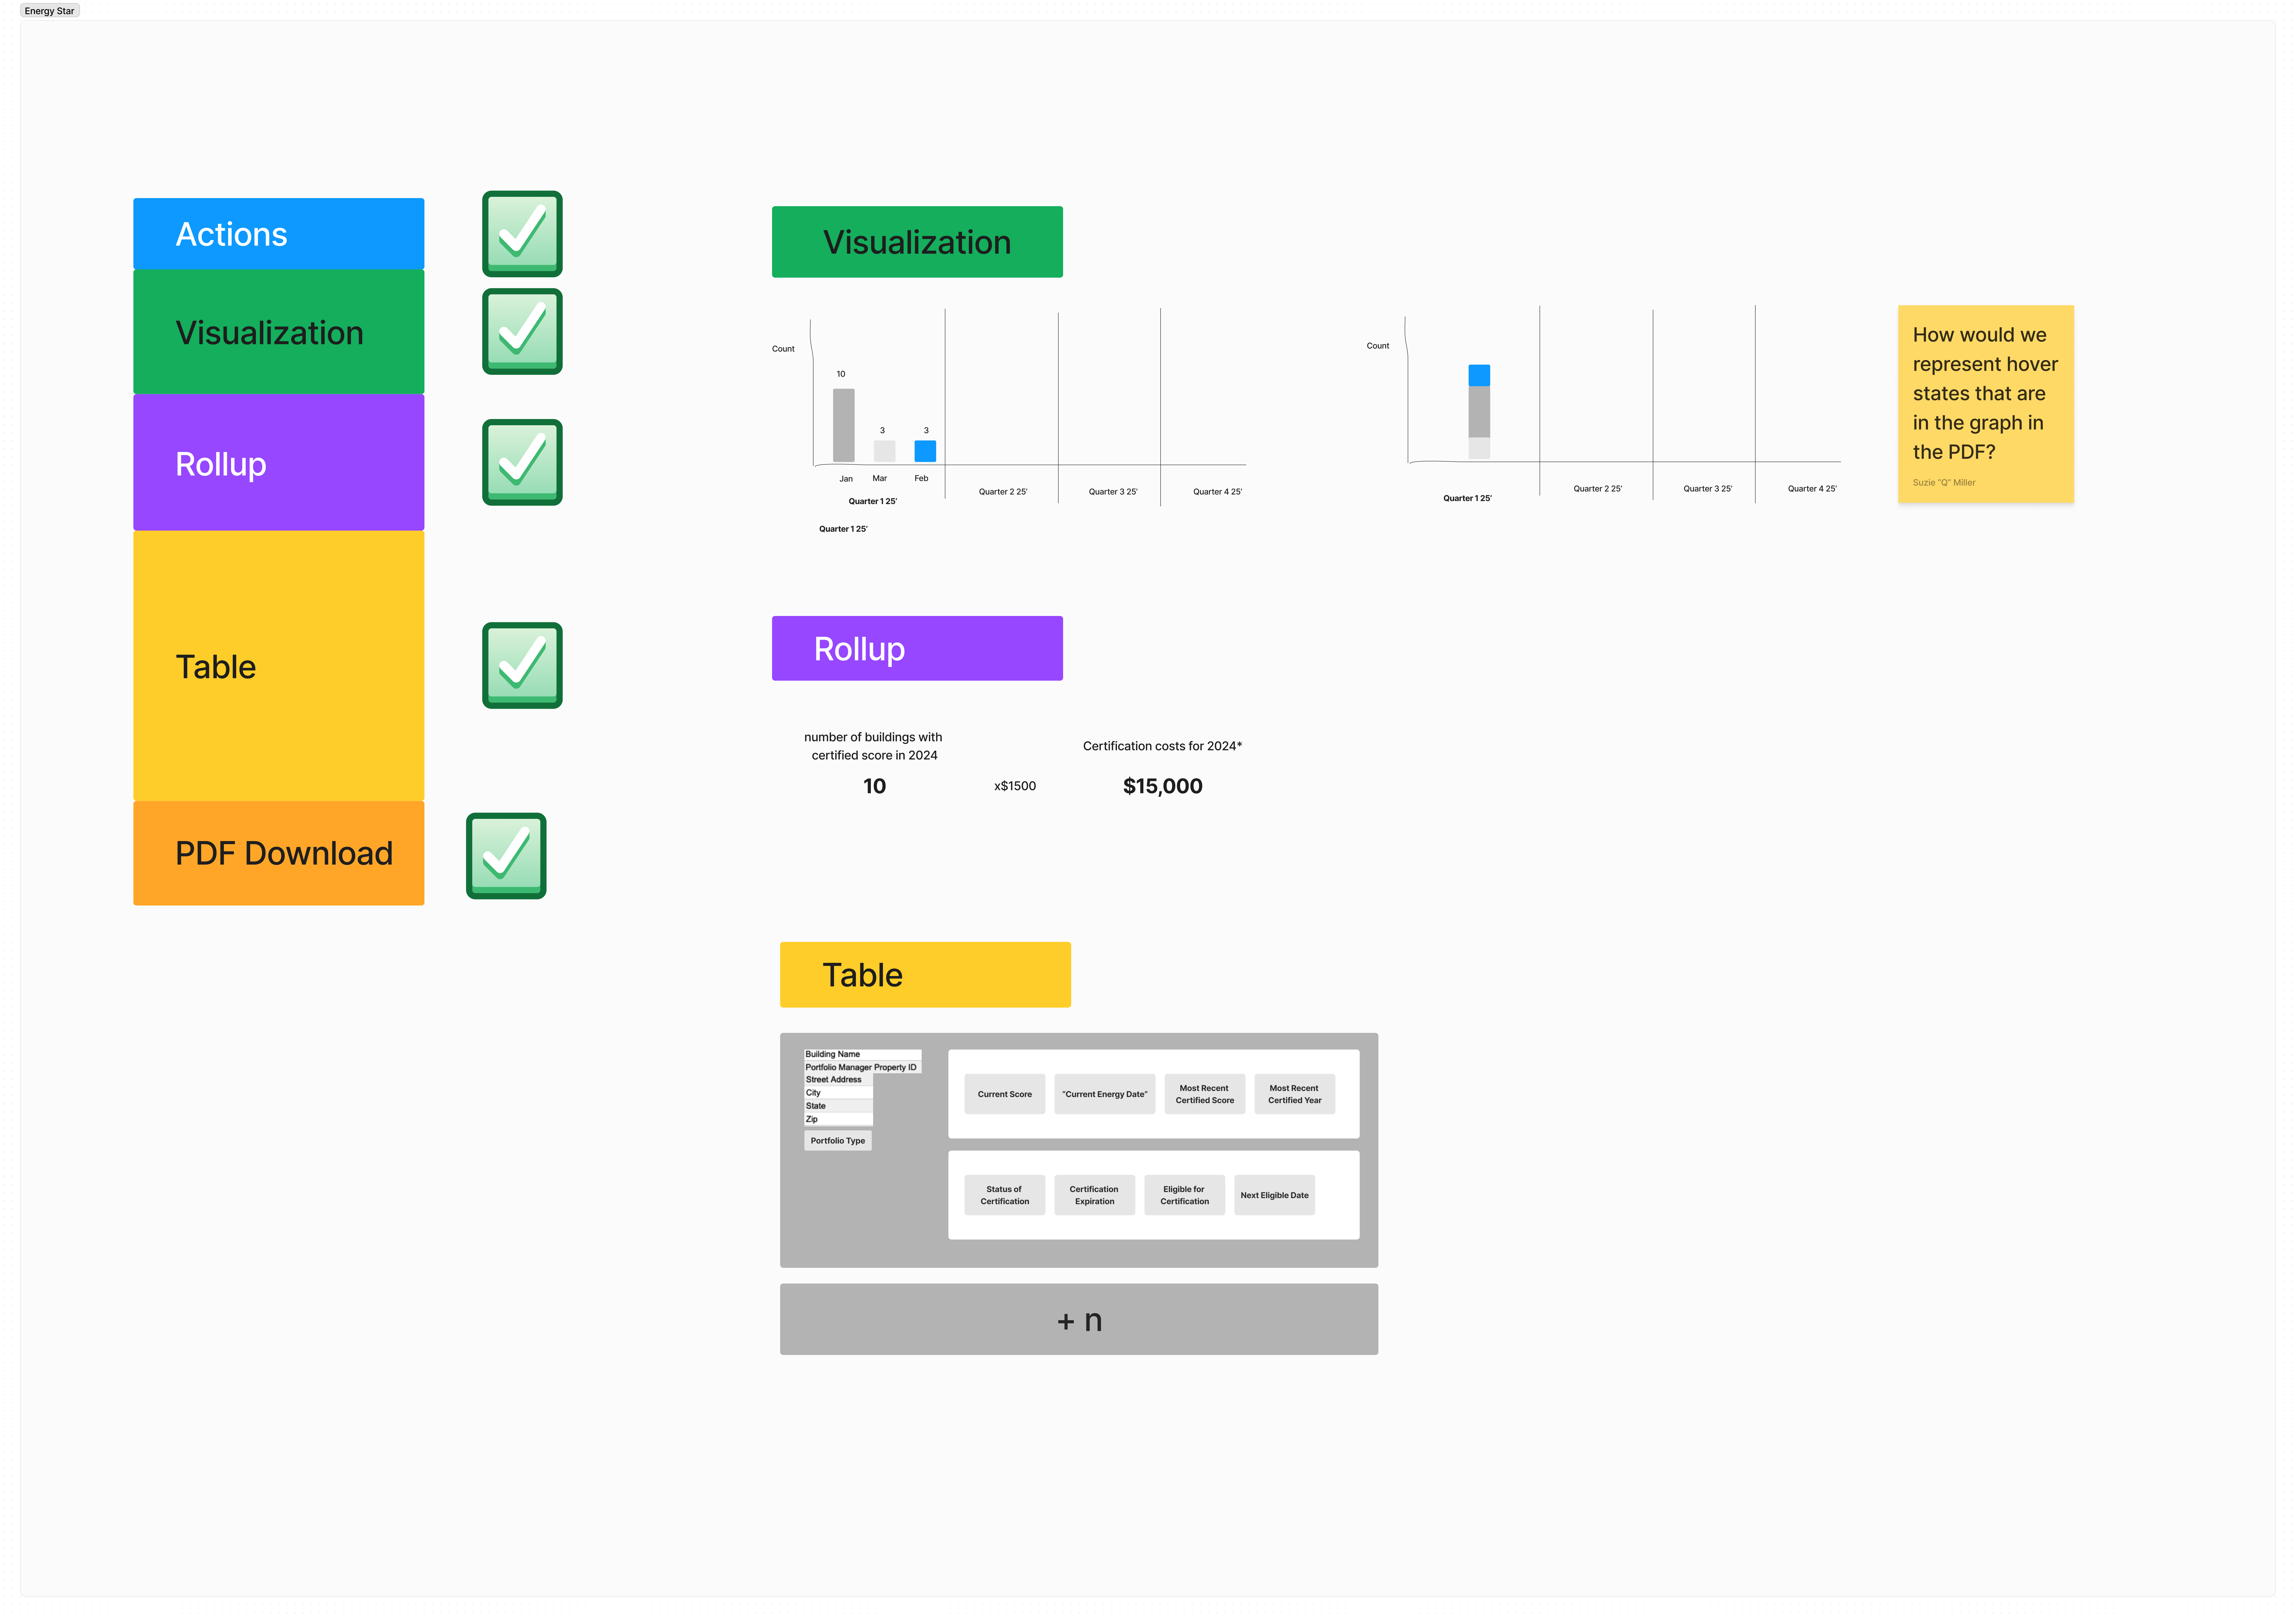
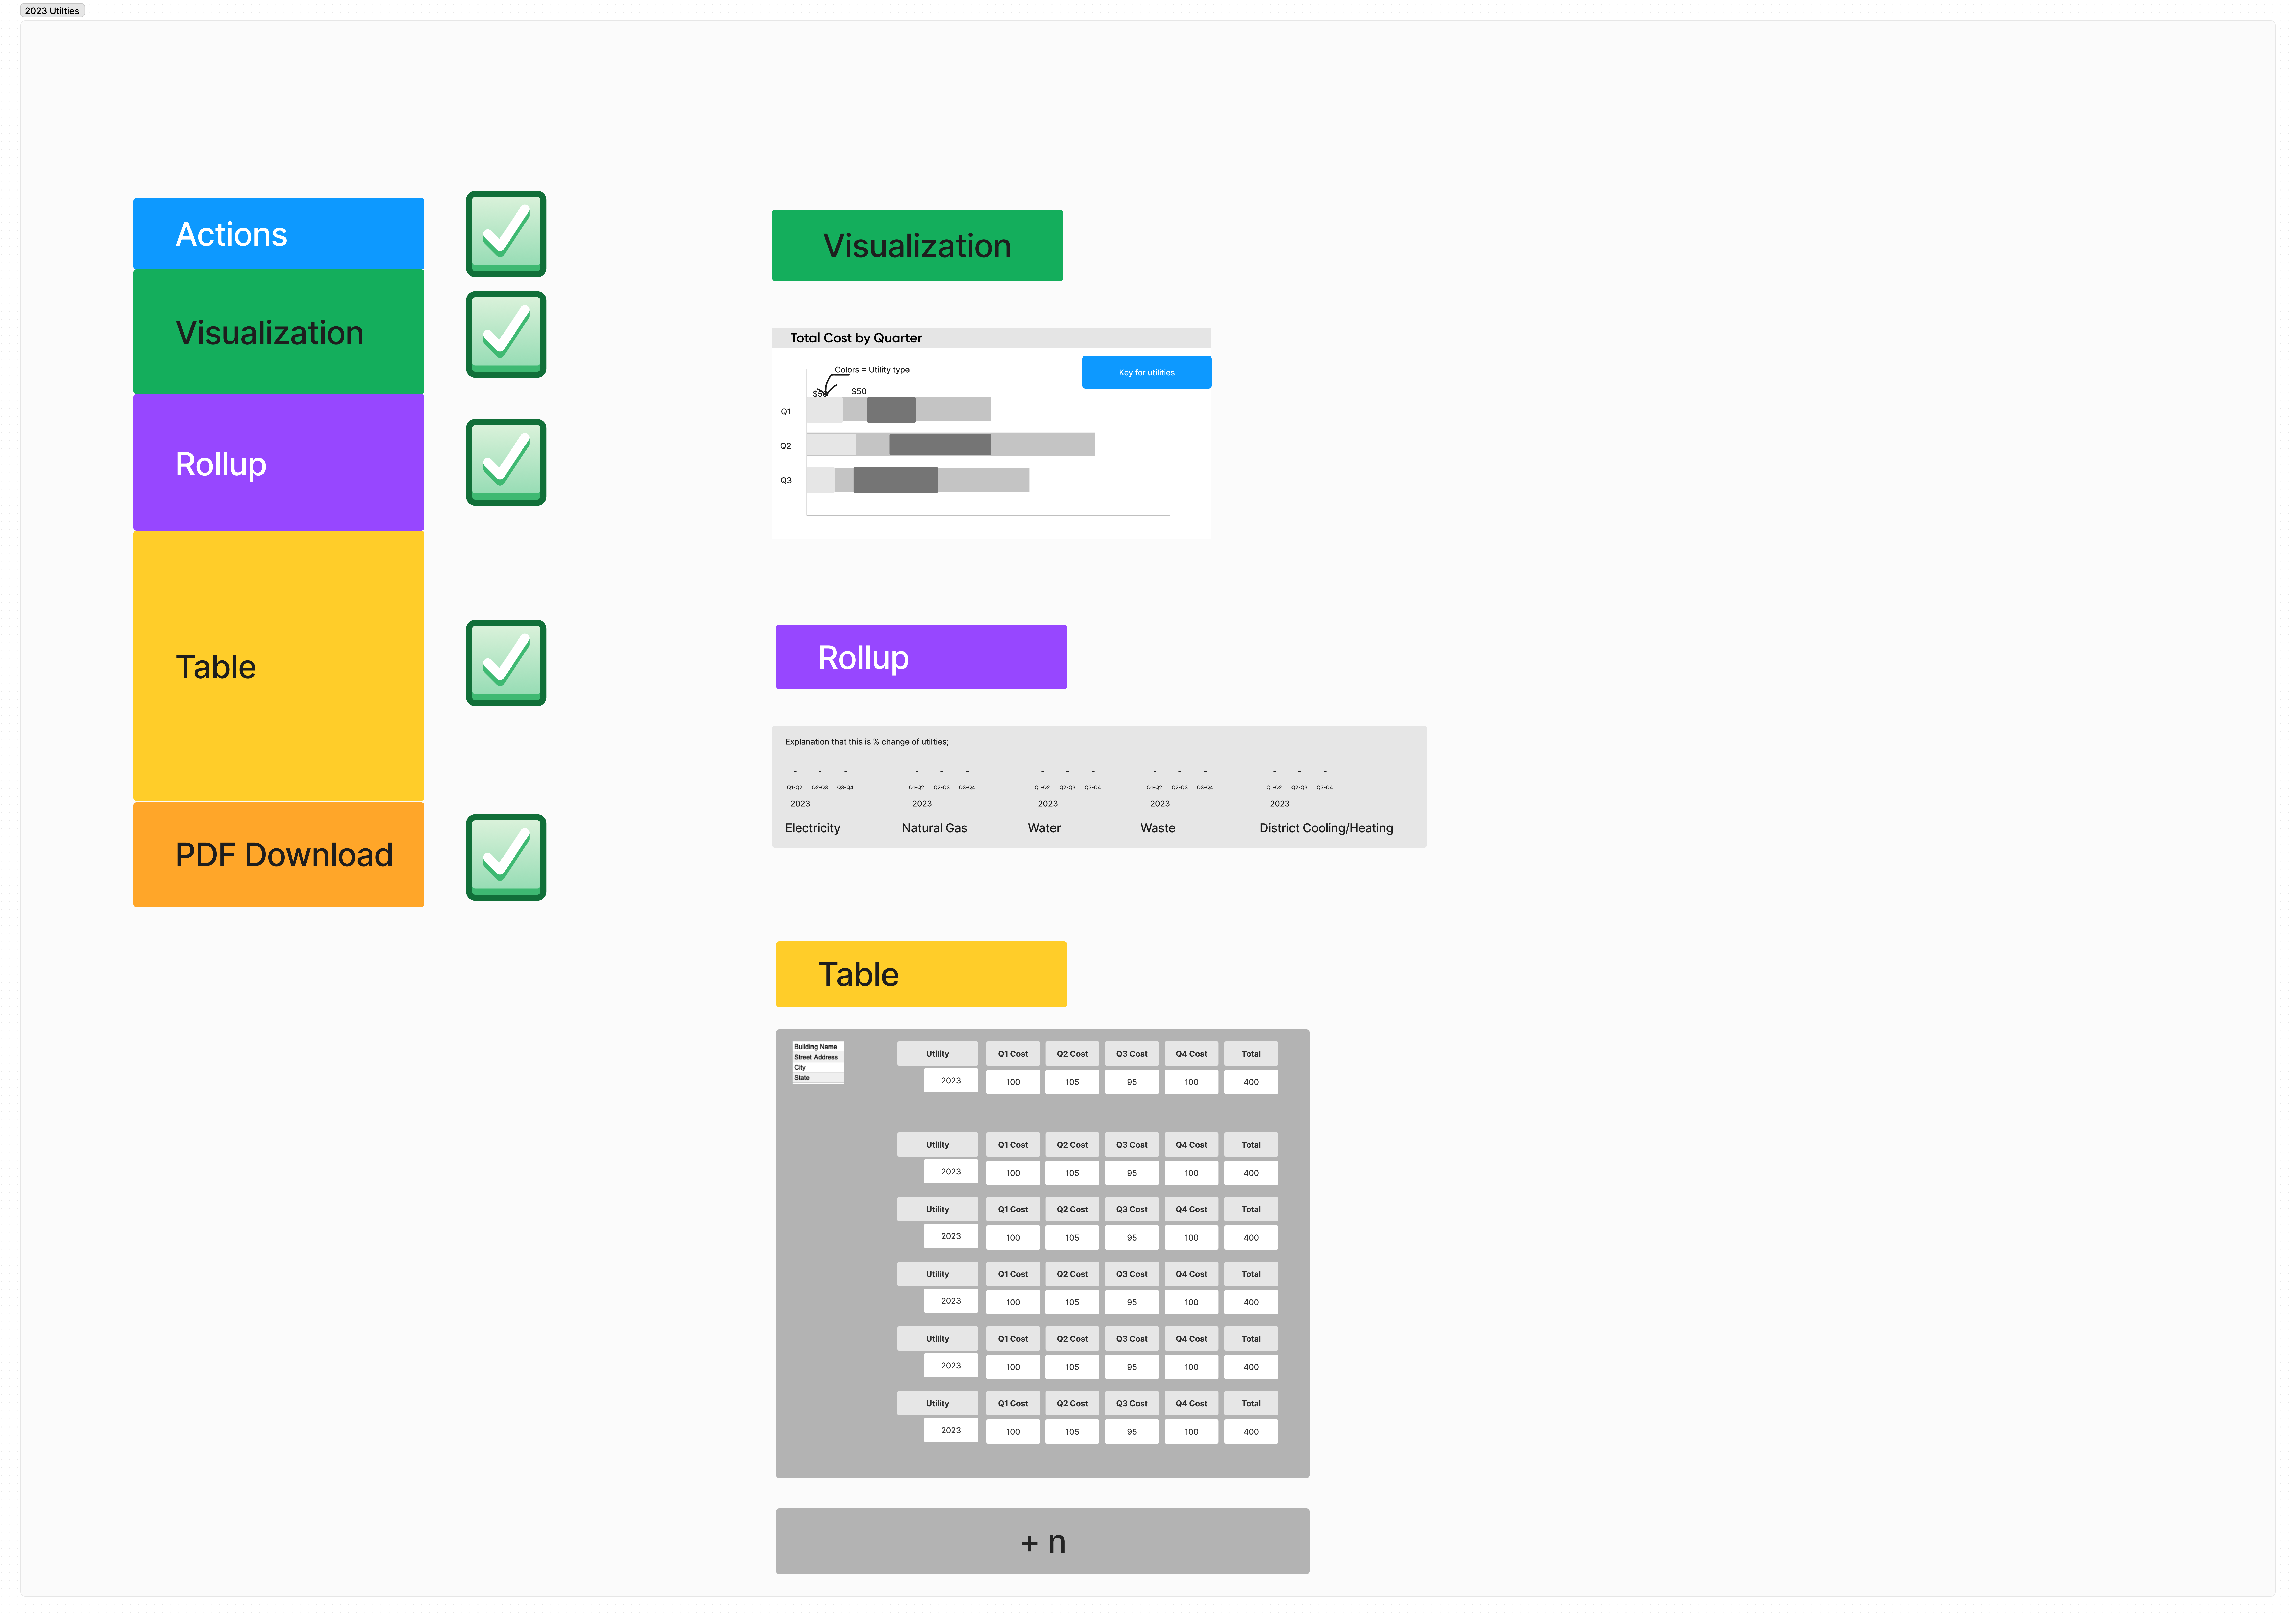
Utilized sketching, diagramming, and wireframing to understand what visualization best supports the dataset of each report.
Sketches

Lo-Fi Wireframing
Understanding the Rollup Section
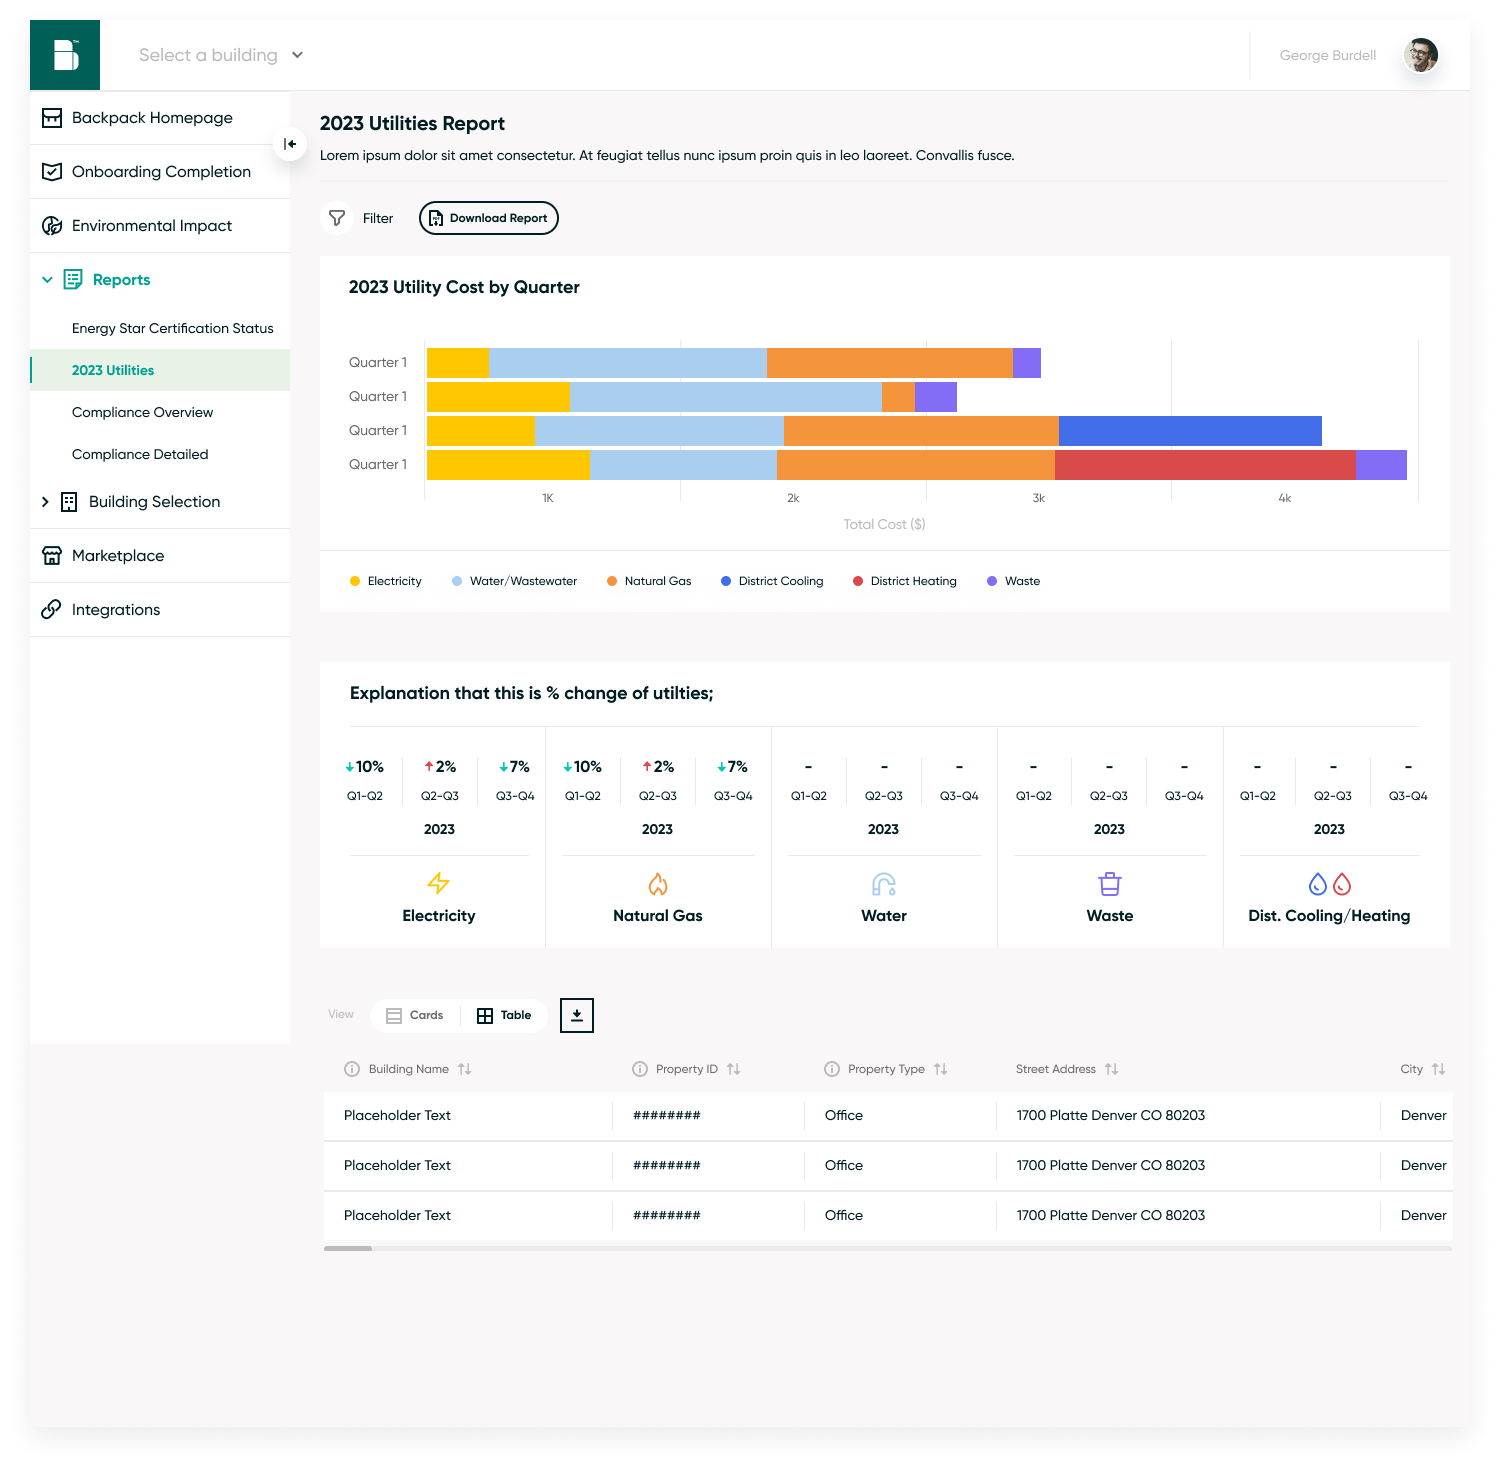
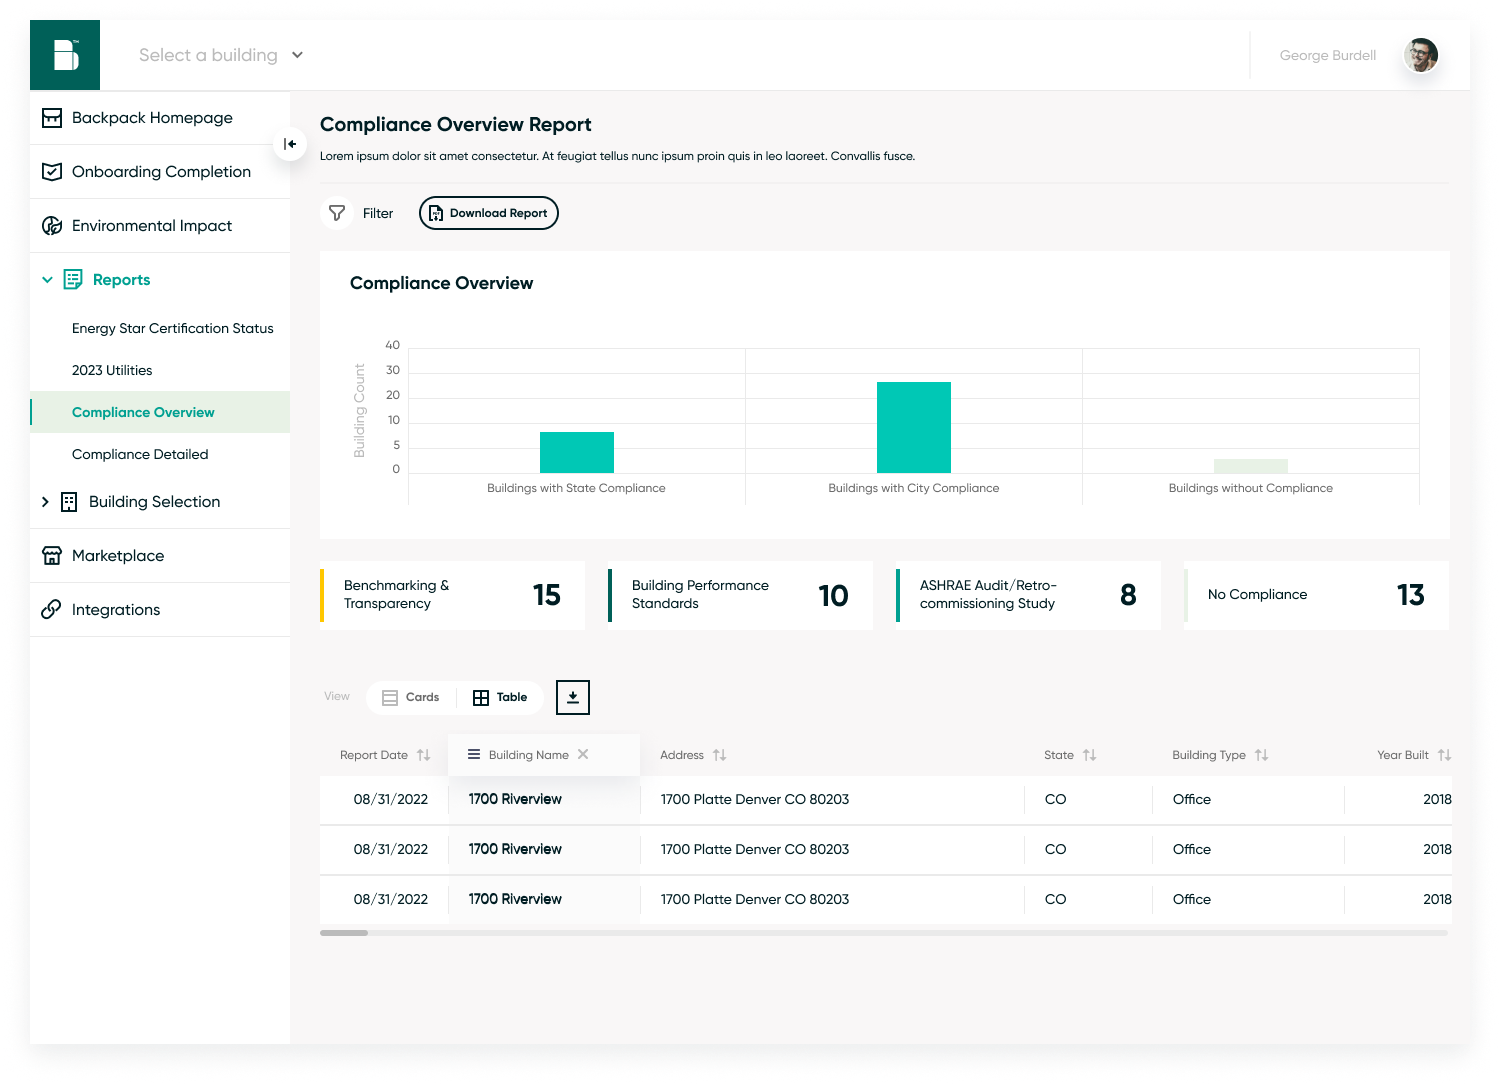
Mid-Hi Fi Wireframes

final design
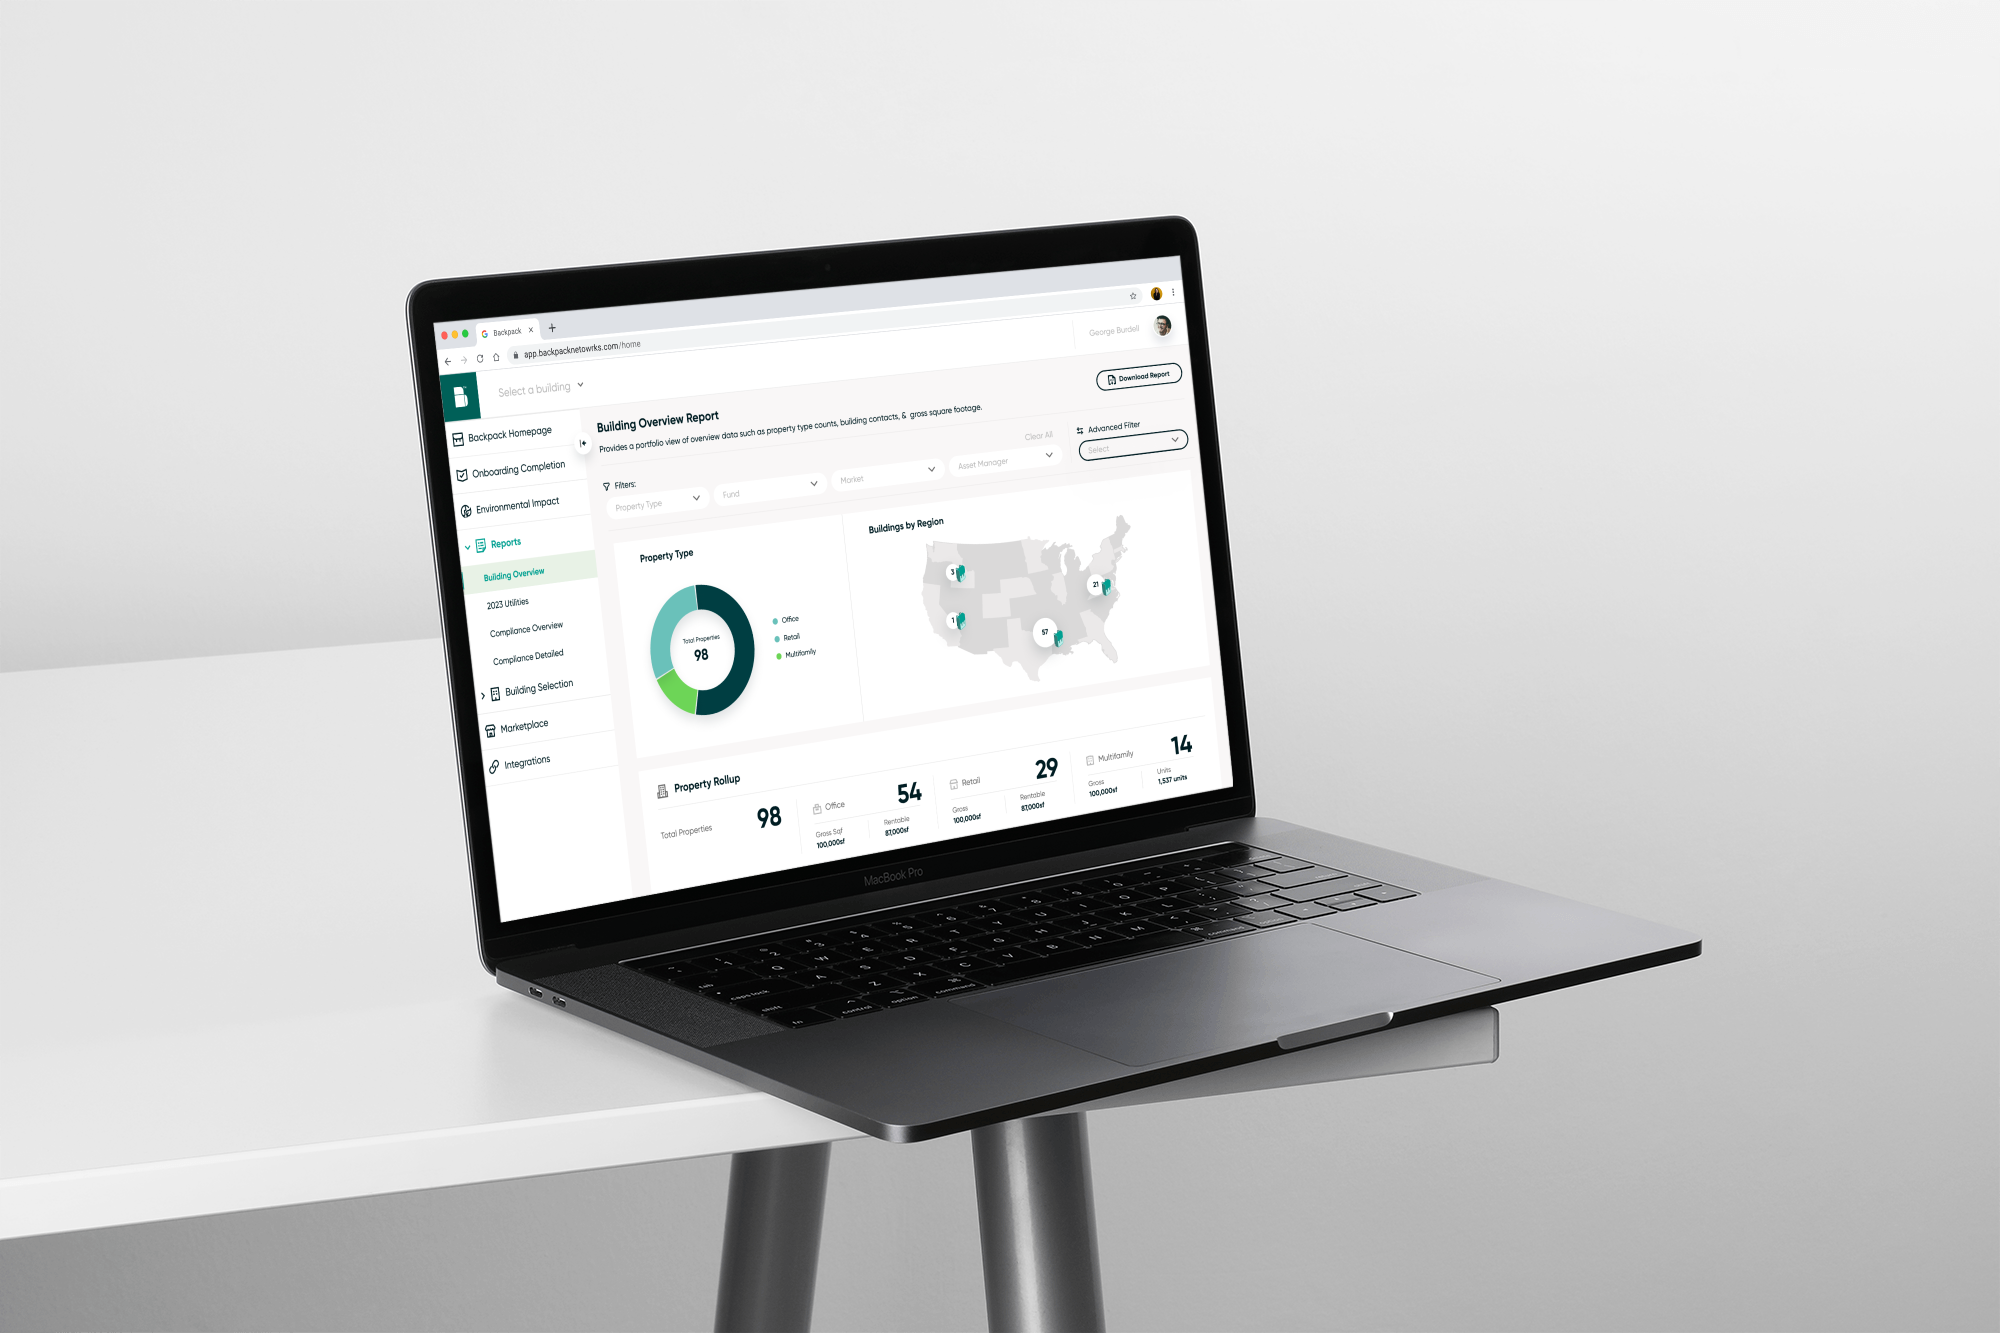
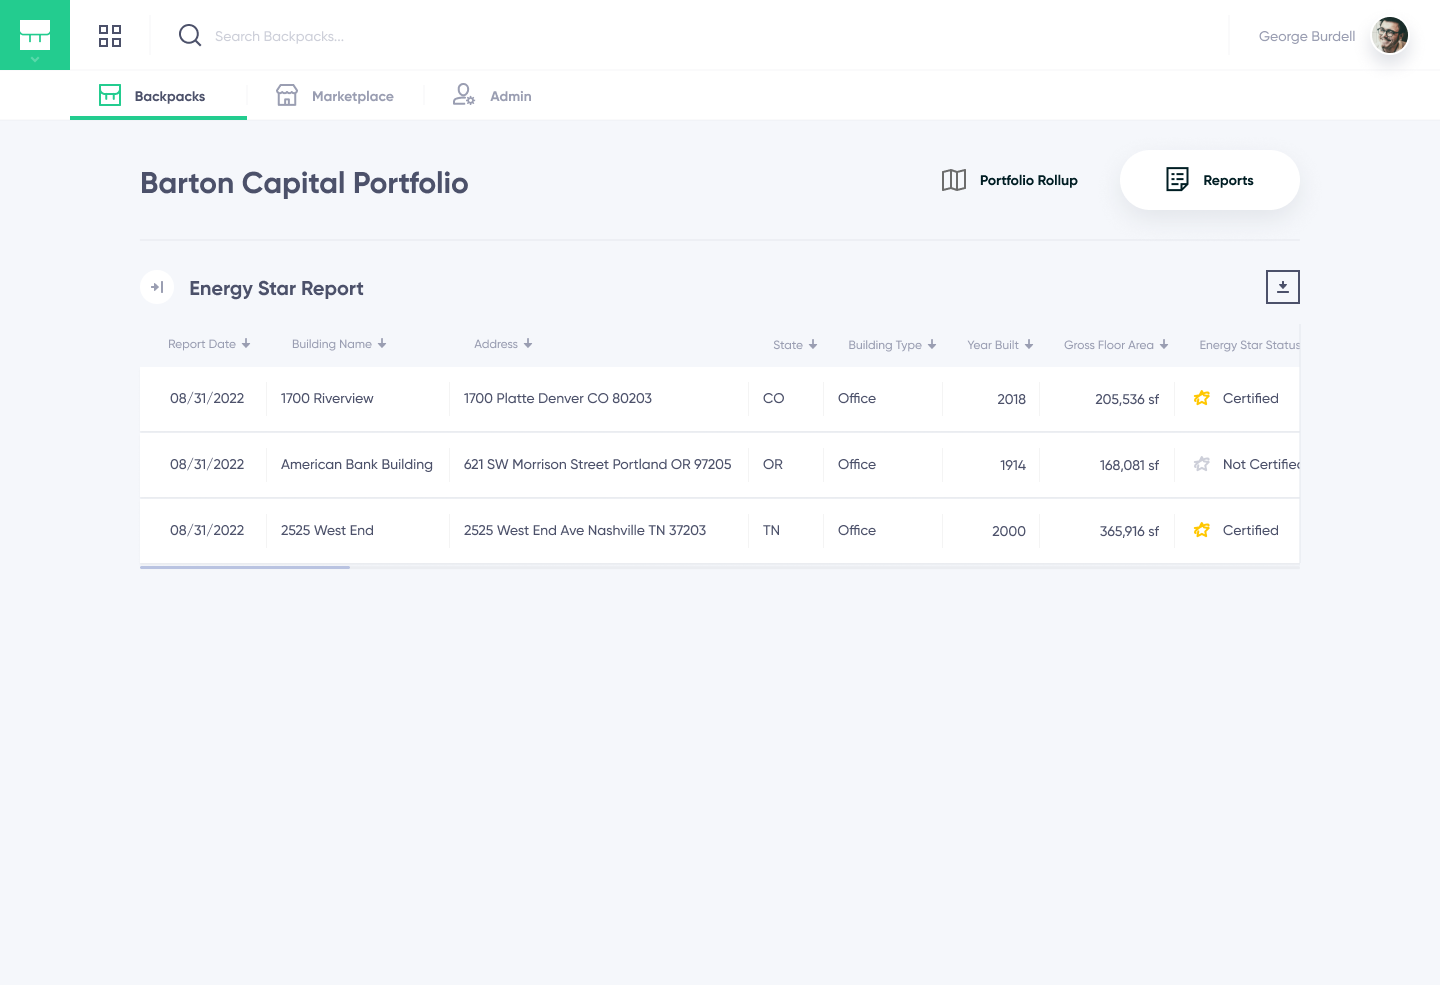
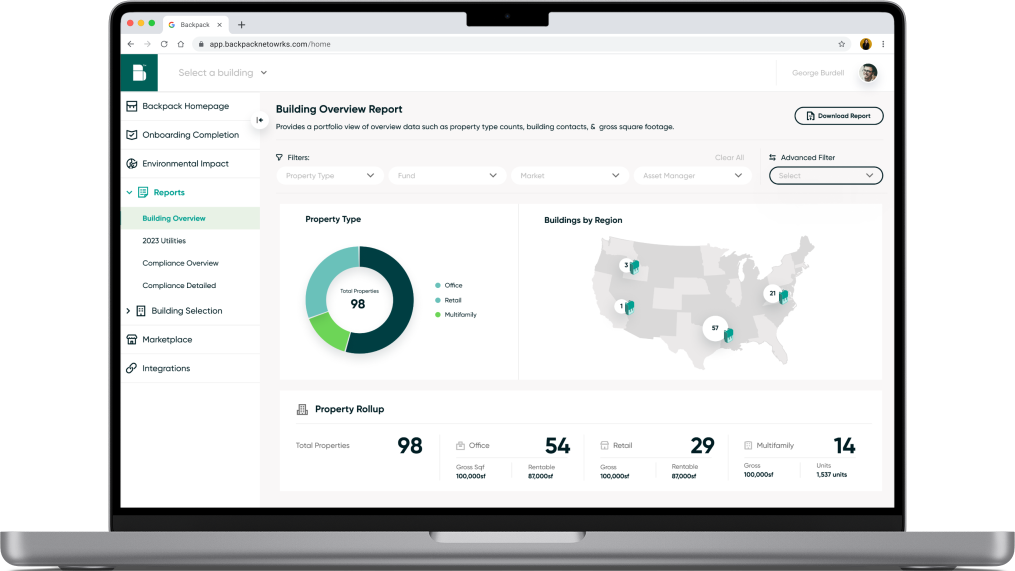
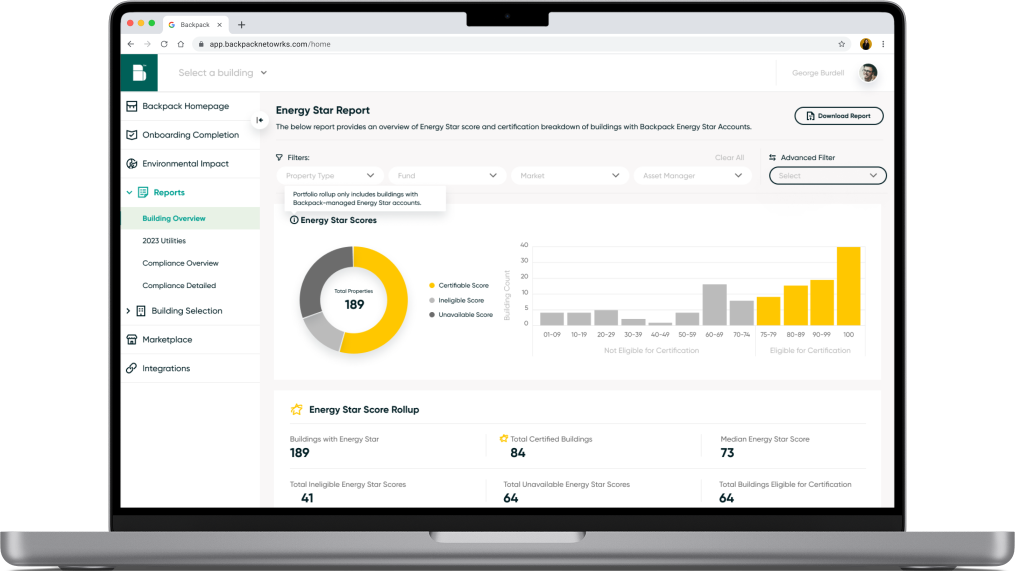
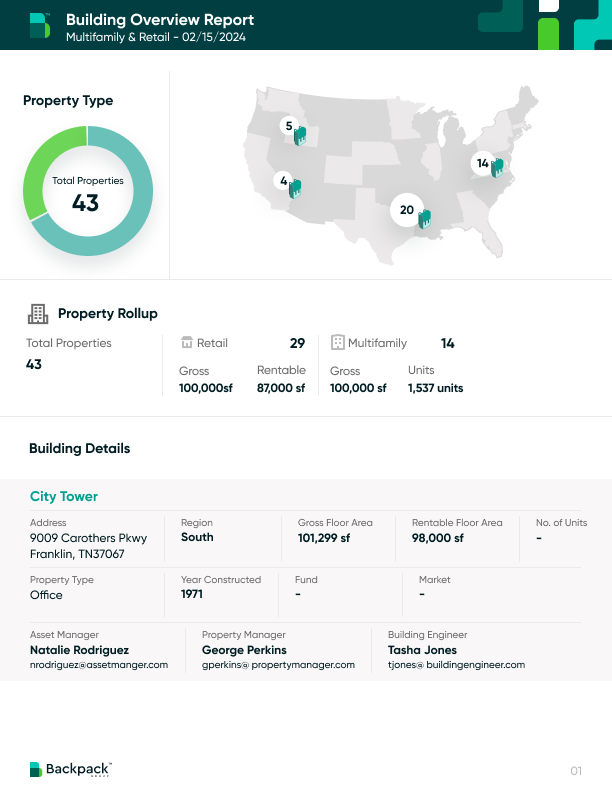
We implemented a template that established UX and UI patterns for all new reports. This makes future reports that need fast turnaround easy to drop into the software.
Building overview report
energy star report
Building Overview PDF Export
Card to table